How to Monitor Cloud Resources with Grafana Plugins

How to Monitor Cloud Resources with Grafana Plugins
Monitoring multiple cloud platforms can be a headache, but Grafana plugins make it simpler by bringing all your metrics, logs, and events into one dashboard. Whether you're keeping tabs on AWS EC2, Google Cloud services, or Oracle Cloud resources, Grafana lets you monitor everything side by side without switching between tabs.
Here’s the gist:
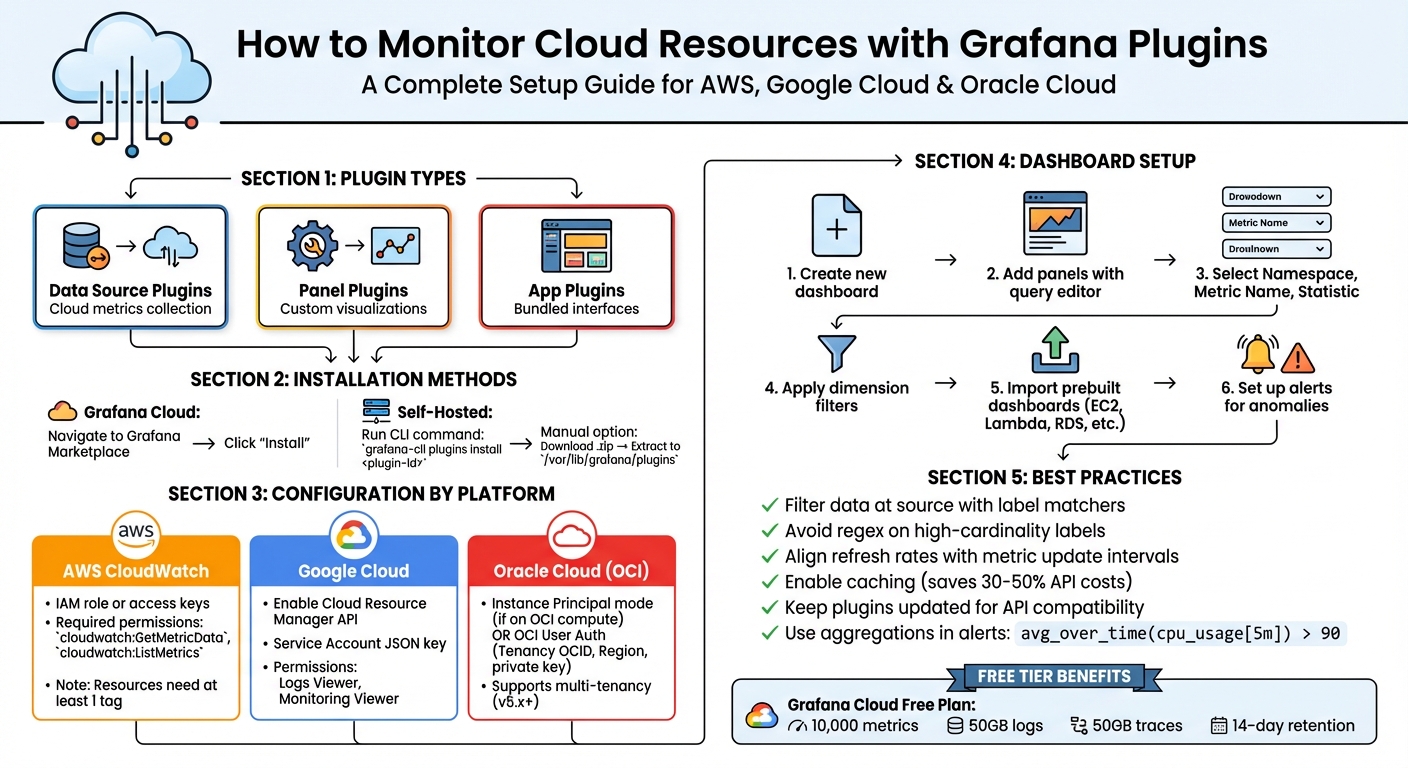
- Plugins: Use data source plugins for cloud metrics, panel plugins for custom visualisations, and app plugins for bundled interfaces.
- Unified Dashboards: Combine metrics from AWS, Google Cloud, and OCI with other data sources like databases or APIs.
- Alerts: Set real-time notifications for spikes in CPU usage or low storage.
- Prebuilt Dashboards: Save time by importing ready-made dashboards for services like AWS Lambda or Google Cloud Monitoring.
- Free Tier: Grafana Cloud’s free plan includes 10,000 metrics and 50GB each for logs and traces, with 14-day retention.
Installing plugins is easy - use the Grafana Marketplace for cloud setups or the CLI for self-hosted instances. Once installed, configure them with the right authentication for your cloud provider (e.g., IAM roles for AWS, service accounts for Google Cloud). From there, you can create dashboards tailored to your needs or use prebuilt templates to get started quickly.
Pro Tip: Write efficient queries to save costs and improve performance. For example, filter data at the source and align refresh rates with metric update intervals. And don’t forget to keep plugins updated to avoid compatibility issues with cloud APIs.
If you’re managing multi-cloud infrastructure, perhaps with the help of a fractional CTO, Grafana plugins are a no-brainer for simplifying monitoring and saving time. Ready to set up your first dashboard?
Complete Guide to Setting Up Grafana Cloud Monitoring Plugins
Installing and Setting Up Grafana Plugins
Installing Plugins via UI and CLI
How you install Grafana plugins depends on whether you're using Grafana Cloud or running a self-hosted instance. For Grafana Cloud users, it’s as simple as going to the Grafana Marketplace or your plugin management interface and clicking "Install." Easy, right?
For self-hosted setups, you'll need to use the CLI. Fire up your terminal and run:
grafana-cli plugins install <plugin-id>
Replace <plugin-id> with the plugin you need. For instance, if you're after the Google Cloud Logging plugin, you'd use googlecloud-logging-datasource. Once you've installed the plugin, don’t forget to restart your Grafana server so it can detect the new addition.
In more restricted environments, like air-gapped setups, you’ll need to manually download the plugin as a .zip file. Extract it into Grafana's plugin directory, usually located at /var/lib/grafana/plugins.
Some plugins, like the Amazon CloudWatch plugin, come pre-installed with Grafana. After installation, you’ll need to add the plugin as a data source by navigating to Settings > Data sources. This setup step is essential before you can start building dashboards to monitor your cloud resources.
Once your plugins are installed, the next step is to configure them for your specific cloud platform.
Configuring Plugins for Cloud Platforms
After installation, you'll need to set up each plugin with the right authentication details for your cloud platform.
-
AWS CloudWatch: You’ll need an IAM role or access keys with permissions such as
cloudwatch:GetMetricDataandcloudwatch:ListMetrics. To avoid headaches, use tools like CloudFormation or Terraform to create these roles. If you're integrating with Grafana Cloud, make sure your AWS resources have at least one tag so Grafana can pull metrics properly. -
Google Cloud: Start by enabling the Cloud Resource Manager API and the relevant Monitoring or Logging APIs in the GCP Console. Authentication usually involves a Service Account JSON key with permissions like Logs Viewer or Monitoring Viewer. For better security, you might want to use service account impersonation, which requires the
iam.serviceAccounts.getAccessTokenpermission. - Oracle Cloud (OCI): The authentication method here depends on where Grafana is running. If it’s on an OCI compute instance, you can use Instance Principal mode with a Dynamic Group for simpler authentication. Otherwise, you’ll need to go the OCI User Auth route, which requires your Tenancy OCID, Default Region, and a local private key. If you’re using the OCI Metrics plugin (version 5.x or later), you’ll also benefit from multi-tenancy and cross-tenancy support, making it compatible with Grafana 10 and 11.
Once your data sources are configured, head to the Dashboards tab within the data source settings. Many plugins come with pre-built dashboards that you can import straight away, giving you instant insights without the hassle of creating dashboards from scratch.
sbb-itb-fe42743
Creating Dashboards for Cloud Resource Monitoring
Adding Panels for Core Metrics
To set up a dashboard in Grafana for monitoring essential metrics, start by creating a new dashboard and adding panels. Each panel will use the query editor tailored to your cloud provider. For instance, if you're using AWS CloudWatch, you'll need to select a Namespace (e.g., AWS/EC2), pick a Metric Name (like CPUUtilization), and decide on a Statistic such as Average or Maximum.
You can use dimension filters to narrow down data to specific resources, such as filtering by InstanceId or Region. For Google Cloud Monitoring, you can simplify panel legends by using alias patterns such as {{metric.name}} or {{resource.label.zone}}, which replace long resource identifiers with more readable labels.
For AWS data retrieval, you’ve got two main options: Scrape Jobs (where Grafana fetches data via API) or Metric Streams (which push data through Kinesis Data Firehose). Just keep in mind that GetMetricData requests in CloudWatch aren’t covered under the free tier, so you might incur costs.
Another important point: many cloud integrations require resources to have at least one tag in the provider's console before they can appear in Grafana. For Oracle Cloud, the OCI Metrics plugin supports dynamic filtering with functions like dimensions() and dimensionOptions(), making it easier to adjust panel data based on specific resource values.
Using Prebuilt Dashboards
Once your core metrics panels are in place, you can speed things up by using prebuilt dashboards. These curated dashboards, available with most cloud plugins, provide ready-to-use visualisations for common services. For example, Amazon CloudWatch offers dashboards for EC2, EBS, Lambda, CloudWatch Logs, and RDS. To use them, go to your data source configuration page in Grafana, click on the Dashboards tab, and hit Import.
Prebuilt dashboards are a great starting point, but if you tweak one to suit your needs, make sure to save it under a new name. This way, future plugin updates won’t overwrite your customisations.
For Google Cloud Monitoring, you can also use template variables (with Query type) to add dropdown menus. These menus let you switch between projects, services, or resource labels dynamically. Just make sure you’ve enabled both the Monitoring API and the Cloud Resource Manager API in the GCP console; otherwise, your projects won’t show up in the dropdown.
To take your monitoring further, pair these dashboards with proactive alerting to catch issues before they escalate.
Setting Alerts for Resource Anomalies
Alerting transforms your dashboards from passive monitoring tools into proactive problem solvers. In Grafana, you can set up alert rules to notify you when resources hit critical thresholds or show unusual patterns. For example, you might create an alert for when CPU usage exceeds 80% for more than five minutes, or when available storage falls below 10 GB.
For AWS and Oracle Cloud, you can configure alerts directly in Grafana. With Google Cloud, you’ll first need to create log-based metrics in Cloud Monitoring and then use those metrics to set up alerts within Grafana.
If you’re managing dashboards with lots of queries or users, keep an eye on your AWS service quotas. For example, you may need to request an increase for GetMetricData or ListMetrics calls if you’re nearing API limits. The CloudWatch plugin also supports cross-account observability, so you can monitor resources across multiple AWS accounts and regions from a single dashboard.
Best Practices for Monitoring Cloud Resources with Grafana
Writing Efficient Queries
How you write your queries can make or break your monitoring setup - both in terms of performance and cost. One golden rule? Filter data at the source. Instead of pulling in massive datasets and filtering them in Grafana, use label matchers to narrow things down early. For example, something like {job="api"} is far more efficient than fetching everything and sorting it out later.
Avoid using regular expressions on high-cardinality labels - they’re performance killers. Stick to specific metric names like http_requests_total rather than vague patterns like {__name__=~".*_total"}. Also, make the most of Grafana’s built-in macros, such as $__timeFilter, to limit queries to the relevant time range.
Another tip: align your dashboard refresh intervals with how often your cloud metrics update. If your CloudWatch metrics only change hourly, there’s no point in setting a refresh rate of 30 seconds - it just adds unnecessary load. Enable caching in grafana.ini to keep frequently queried results handy, potentially cutting API costs by 30–50% [8][9]. Just remember that CloudWatch’s GetMetricData API doesn’t fall under AWS’s free tier [1], so every query tweak adds to your bill.
When setting up alerts, use aggregations like avg_over_time(cpu_usage[5m]) > 90 to avoid flapping alerts caused by short-lived spikes. And finally, keep your queries lean and efficient by regularly updating your plugins - more on that below.
Keeping Plugins Updated
Keeping your plugins up-to-date isn’t just about getting the latest features - it’s also about staying compatible with cloud provider APIs. For example, Amazon CloudWatch is natively supported in Grafana, so updates to its functionality often come bundled with Grafana’s core releases. If you’re using third-party plugins, prioritise those developed by Grafana Labs or official partners. They tend to be updated more frequently and come with better long-term support compared to community-made plugins.
If you’re on Grafana Cloud, managed integrations like "Cloud Provider Observability" can make life easier. These integrations are maintained by Grafana Labs, so they automatically adapt to changes in AWS, Azure, or GCP APIs without you lifting a finger. Running a self-hosted setup? Tools like Terraform can help you manage plugin updates programmatically. Just set the version parameter to "latest" in the grafana_cloud_plugin_installation resource, and you’ll always have the newest stable version [4].
Fixing Common Issues
Even with everything set up, hiccups can happen. If pre-configured dashboards suddenly show blank panels after an update, try using the "Reset to defaults" option in the service settings. This ensures all the necessary metrics are being scraped properly [11].
Connection errors are another common headache and are often due to authentication or permission issues. Double-check that the required cloud APIs - like Google Monitoring and Cloud Resource Manager APIs - are enabled. Also, make sure your service accounts have the right roles, such as "Monitoring Viewer" [5]. If you’re hitting API rate limits, it might be time to review your cloud provider’s service quotas and request an increase if needed [1].
Don’t forget to keep an eye on the health of your monitoring setup itself. Meta-monitoring metrics, like grafanacloud_grafana_instance_alerting_state_history_writes_failed_total, can help you spot problems with data source connectivity or authentication [12]. And if your AWS metric streams aren’t working, check that they’re using the OpenTelemetry 1.0 format instead of JSON [10]. These small checks can save you a lot of troubleshooting time down the line.
Conclusion
Summary of Key Points
Grafana plugins simplify cloud monitoring by seamlessly integrating essential metrics and alerting features. They bring together scattered monitoring tools into one cohesive platform, saving teams from the hassle of switching between multiple consoles. As noted, “The Amazon CloudWatch data source in Grafana extends these capabilities by allowing you to query CloudWatch data and create rich, interactive visualisations that can be correlated with data from other systems within unified dashboards” [1].
The direct API integration is a game-changer - it removes the need for managing collectors, with metrics flowing straight from cloud APIs like Azure Monitor and Amazon CloudWatch [2][6]. Pre-configured dashboards for services such as EC2, RDS, and Lambda make it quick and easy to visualise data, while automated resource discovery (like Azure’s two-minute refresh cycle) ensures new resources are monitored without manual input [1][6].
Security is another strong point, with options like IAM roles and Instance Principals eliminating the need for managing long-term credentials [3][7]. Features such as cross-account observability and SLO queries allow teams to stay ahead of potential issues, focusing on maintaining service health rather than simply reacting to incidents [1][5]. Plus, secure integrations and automatic updates keep operations smooth and efficient.
Introduction to Monitoring AWS Resources in Grafana Cloud | Grafana
FAQs
Which Grafana plugin types do I need for cloud monitoring?
Grafana offers several plugin types that are particularly useful for cloud monitoring. Among the most important are native data sources like Amazon CloudWatch and Google Cloud Monitoring. These plugins let you pull in and visualise metrics, logs, and events directly from your cloud providers, giving you a clear picture of what's happening in your infrastructure.
If you need something more tailored, you might want to look at additional plugins for creating custom dashboards or monitoring specific aspects of your infrastructure. These can be easily managed using tools like Terraform or Grafana's built-in plugin management system, making setup and updates straightforward.
How do I securely authenticate Grafana to AWS, GCP or OCI?
To set up secure authentication for Grafana with AWS, GCP, or OCI, here’s how you can do it for each provider:
- AWS: Set up an IAM role with the necessary permissions. You can then link it to Grafana using access keys or IAM roles. Make sure to only grant the permissions Grafana actually needs.
- GCP: Create a service account with the required permissions. Generate a JSON key for this account, and configure Grafana to use it. Again, limit permissions to the minimum necessary.
- OCI: Use an OCI Dynamic Group with appropriate policies. Configure Grafana to authenticate using Instance Principal, which avoids the need for storing sensitive credentials.
No matter the provider, stick to best practices like applying the principle of least privilege and ensuring credentials are stored securely. Never hard-code sensitive information into your applications or configuration files.
How can I reduce API costs and avoid rate limits in Grafana?
To keep API costs down and sidestep rate limits in Grafana, you can lean on native plugins like Google Cloud Monitoring or Amazon CloudWatch, which are designed to make data retrieval more efficient. A smart move is to set up dashboards with pre-defined metrics, cutting down on unnecessary API requests.
It’s also worth managing your data streams thoughtfully - avoid redundant data pulls and make use of caching to simplify queries. Where possible, set rate limits to keep things under control. For a more hands-off approach, tools like Terraform can help automate the setup and monitor API usage effectively.