Integrating Performance Testing into CI/CD Pipelines
Integrating Performance Testing into CI/CD Pipelines
Performance testing often gets ignored in CI/CD pipelines, but skipping it can cost you - big time. Apps that don’t perform well see 53% of users bail if they’re just a few seconds too slow. Fixing performance issues early (at the commit stage) takes minutes, but waiting until production? That’s hours, not to mention the expense.
Here’s the solution: integrate performance testing into your CI/CD workflow. Run lightweight load tests on every pull request, schedule deeper tests nightly, and stress test before major releases. This helps catch slowdowns, bottlenecks, and concurrency issues long before they reach your users.
Key takeaways:
- Why bother? Catching performance bugs early is faster and cheaper.
- How? Use tools like k6, Locust, or Gatling to automate tests.
- Best practices: Test in production-like environments, set performance thresholds (e.g., p95 response time under 500ms), and use quality gates to block bad builds.
Want fewer 3am fire drills? Start testing performance as part of your daily workflow. It’s not just about avoiding headaches - it saves money and keeps users happy.
How to add performance testing to CI/CD pipelines using k6 and GitHub Actions
sbb-itb-fe42743
Why Add Performance Testing to CI/CD
Adding performance testing to your CI/CD pipeline isn't just a nice-to-have - it’s a must if you want to deliver reliable software consistently. Think of it as a safety net, catching performance issues early when they’re still cheap and simple to fix, rather than letting them snowball into costly problems that impact users and revenue.
Catching Issues Before Production
We’ve all heard the dreaded phrase: “It worked in staging!” Nine times out of ten, this boils down to concurrency issues. Sure, functional tests might pass in a controlled development environment, but what happens when 500 users hit the same endpoint at the same time? That’s when you realise your ORM connection pool is maxed out, or a missing database index has turned a 5ms query into a sluggish 800ms bottleneck [2].
"Performance regressions are bugs, and like all bugs, they are cheapest to fix when caught early." - LoadForge [2]
By running smoke load tests on every pull request - just 10–20 virtual users for 2–3 minutes - you can spot major regressions before they’re merged into the main branch [2]. This "shift-left" approach transforms quarterly audits into continuous feedback loops. Developers get clear, measurable data during code reviews instead of vague comments like, “This feels slow” [5]. For example, if someone accidentally removes an index hint during a refactor, you’ll catch it right away - long before it causes a production outage. And as a bonus, this sets you up for validating your system’s scalability down the line.
Better Scalability and Reliability
Catching issues early is great, but regular performance testing also ensures your system scales smoothly as traffic grows. It’s easy to say, “Our app should scale,” but proving it is another matter entirely. A layered testing approach helps build confidence at every stage: quick smoke tests for every pull request, more thorough nightly runs to detect creeping response time issues, and stress tests before major releases to push your system beyond expected traffic levels [2].
This strategy isn’t just theoretical - it can cut production issues by up to 30% [1]. You’re not just confirming that your code works; you’re confirming that it works under real-world conditions. Problems like connection pool exhaustion, race conditions, and thread queuing don’t show up in unit tests - they only surface under heavy, multi-user loads. By catching these in your CI/CD pipeline, you avoid those 3am fire drills when traffic unexpectedly spikes.
Lower Costs and Faster Fixes
Let’s talk money. Performance testing might seem like an extra expense, but the costs are peanuts compared to what you’d spend dealing with production failures. Over-provisioning cloud resources to compensate for inefficient code? That adds up fast. And losing users because your app is slow? That’s even worse for your bottom line.
Automating performance testing also saves time. By setting up quality gates - like “p95 response time must be under 500ms” or “error rate below 1%” - your pipeline can automatically flag issues [2]. No more wasting hours manually reviewing performance reports. And you can finally skip those frantic quarterly audits where everyone scrambles to clean up months of accumulated technical debt. It’s a win-win for both your team and your budget.
How to Add Performance Testing to CI/CD Pipelines
3-Step Guide to Integrating Performance Testing into CI/CD Pipelines
Integrating performance testing into your CI/CD pipeline doesn't have to be a headache. Here's how you can set up environments, pick the right tools, and automate your tests without slowing down your workflow.
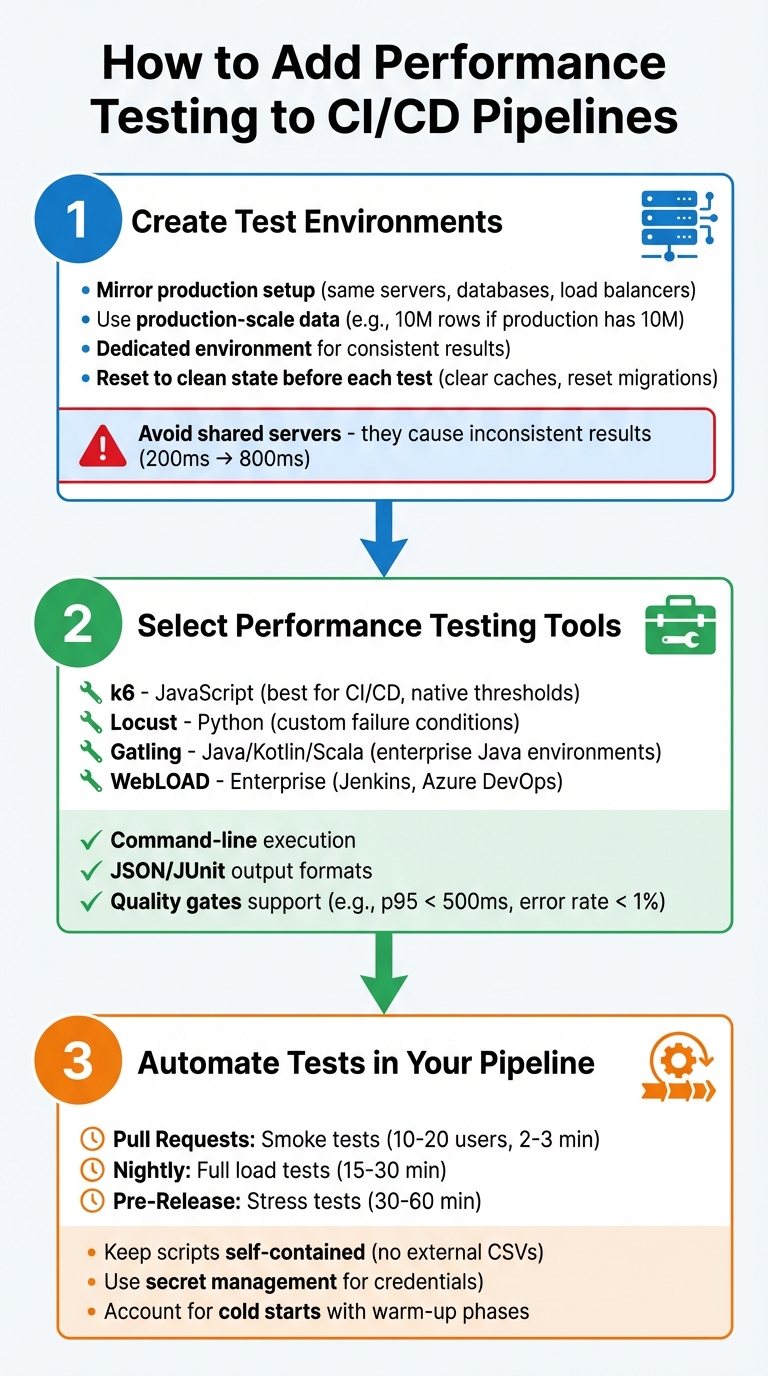
Step 1: Create Test Environments
Your test environment should mimic production as closely as possible. That means using the same server types, database versions, load balancers, and CDNs. If your production database has 10 million rows, your staging environment should too. Testing on an empty database might give you misleadingly good results, which won't hold up once real users log in [2].
It's also a good idea to set up a dedicated environment just for performance testing. If you run these tests on shared servers alongside other integration tests, you'll likely get inconsistent results. For example, your API might respond in 200 ms one day but take 800 ms the next because of interference from other tests [2]. Before running any tests, reset the environment to a clean state - clear caches, reset database migrations, and delete any leftover log files.
Step 2: Select Performance Testing Tools
The right tool makes all the difference. If your team is comfortable with JavaScript, k6 is a solid choice. It’s built for CI/CD, supports thresholds natively, and works well with GitHub Actions, GitLab, and Jenkins [6][4]. For Python fans, Locust is another option, offering flexibility to define custom failure conditions [2]. If you’re working in a Java environment, Gatling is a good fit, supporting Kotlin and Scala [7]. Need something more enterprise-level? WebLOAD integrates with Jenkins and Azure DevOps and can handle distributed load testing [1].
Whatever tool you pick, make sure it supports command-line execution and outputs results in formats like JSON or JUnit. This allows your CI/CD system to automatically decide if a build passes or fails [6][2]. Look for tools that let you define quality gates - specific thresholds like keeping the 95th percentile response time under 500 ms or maintaining an error rate below 1%. These gates can block builds that don’t meet performance standards, saving you from manual checks [6][2].
Step 3: Automate Tests in Your Pipeline
Automation is key to making performance testing a regular part of your pipeline. Most tools, like k6, allow you to trigger tests directly from the command line (e.g., k6 run script.js) [4][2]. Set up your CI platform - whether it’s GitHub Actions, Jenkins, or Azure Pipelines - to run these commands at different stages. For instance:
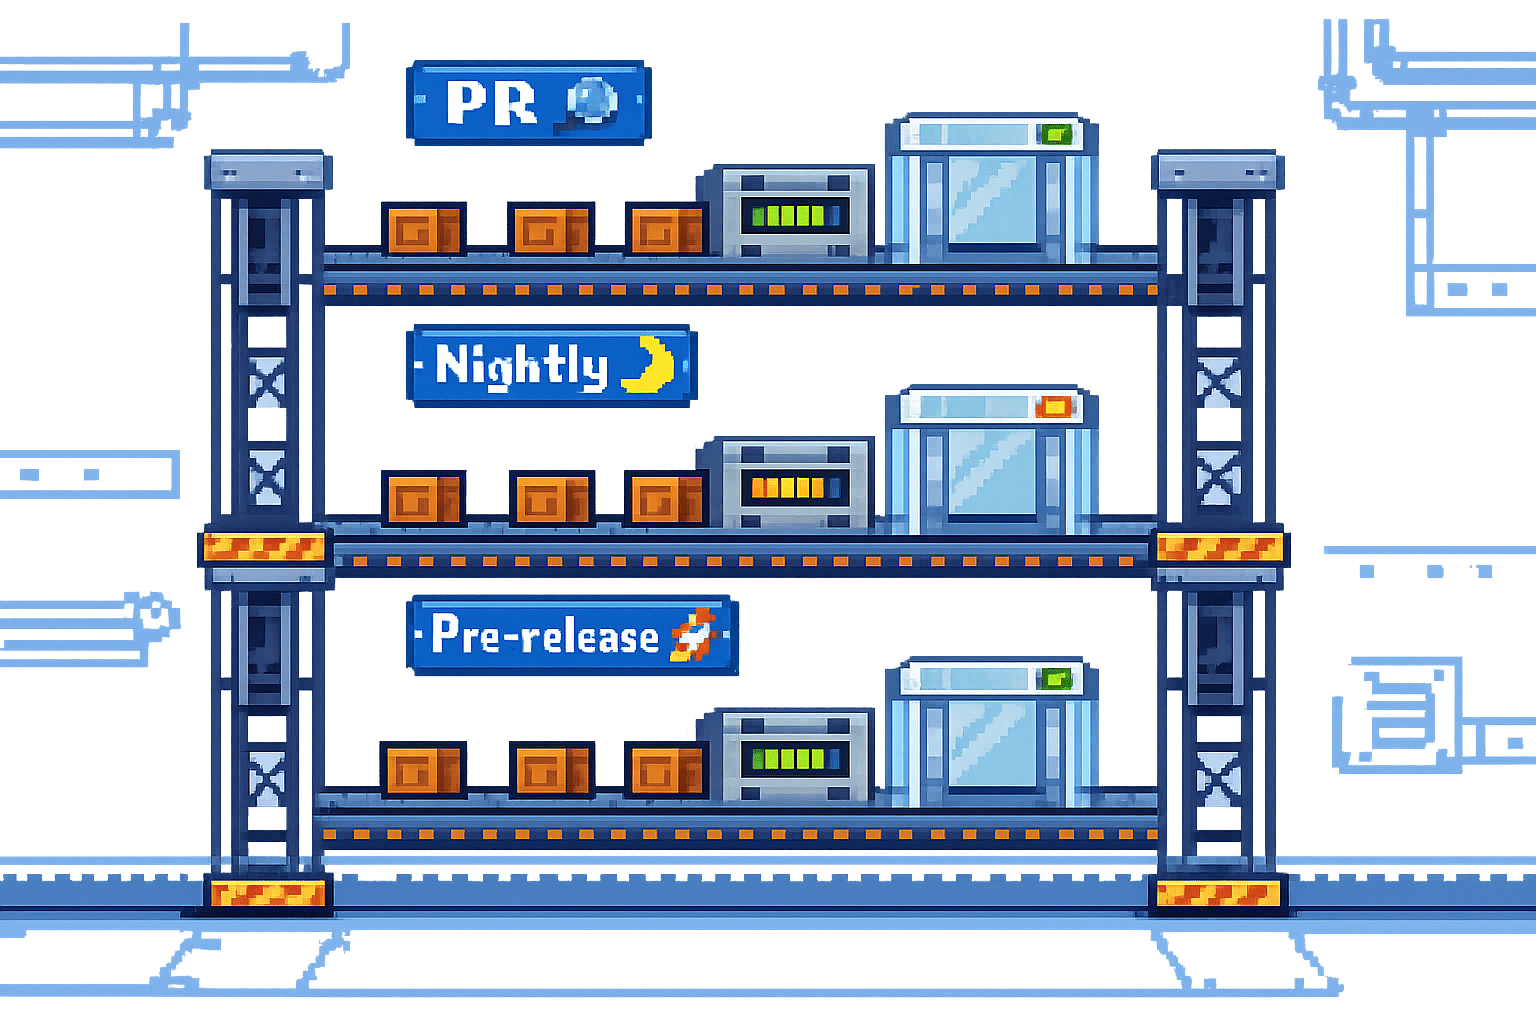
- Run lightweight smoke tests on every pull request (10–20 virtual users for 2–3 minutes).
- Schedule full load tests nightly (15–30 minutes).
- Perform stress tests before major releases (30–60 minutes) [2].
Keep your test scripts simple and self-contained. Avoid relying on external files like local CSVs, as they might not be accessible when running on different pipeline setups [2]. Use your CI/CD platform's secret management features (like GitHub Secrets) to securely handle API keys and credentials, rather than hardcoding them into your scripts [6].
Also, don't forget about cold starts. These can cause higher response times initially due to JIT compilers warming up or connection pools initialising. Either include a warm-up phase and exclude it from your final results, or accept these early outliers as part of the process [2].
At Metamindz, we’ve embraced these steps to make performance testing a seamless part of our CI/CD pipelines. By doing so, we ensure every deployment is ready to handle the demands of real-world users.
Setting Performance Thresholds and Quality Gates
Once you've automated your tests, the next step is to establish clear pass/fail criteria. This removes the need for tedious manual reviews and ensures consistency across the board [2].
Defining Limits for Key Metrics
The first step is to benchmark your application's current performance in a production-like environment. Use this as your baseline, then add a buffer to account for natural variability. For instance, if your p95 (95th percentile) response time in staging is 320 ms, you might set your threshold at 500 ms. That extra 50% headroom helps account for any environmental noise [2]. Similarly, if your baseline error rate is 0.1%, setting the threshold at 1.0% gives you room to identify and manage spikes without being overly restrictive [2].
Focus on metrics that directly impact your users. The p95 response time ensures that the vast majority of users experience acceptable performance, while the p99 metric helps you catch those rare but critical outliers with extreme latency. Aim to keep error rates under 1% to catch regressions that might occur under high concurrency. Also, confirm your system can handle the expected workload - whether that’s 100 requests per second or more. After all, poor performance often leads to high user abandonment rates [8].
Once you've defined these thresholds, integrate them into your pipeline for automatic enforcement.
Automating Quality Gates
Quality gates act as strict checkpoints in your pipeline. If your application exceeds a threshold, the pipeline halts - no exceptions [3]. For critical issues like high error rates or major latency spikes, use hard gates that immediately fail the build. For less severe problems, soft gates can generate warnings without stopping the pipeline entirely [3].
Tools like k6 make this process straightforward. You can define thresholds directly in your test scripts and trigger them via command-line tools in systems like GitHub Actions or Jenkins [4]. The pipeline then parses the test output (usually in JSON format), checks the metrics, and exits with a failure code if any limits are breached [3]. Automating these gates early in your development process saves time, money, and a whole lot of headaches down the line.
Using Monitoring and Feedback for Continuous Improvement
Automated quality gates work best when they’re fed with accurate and up-to-date performance data. To keep your thresholds meaningful, you need a continuous feedback loop that incorporates real-world performance data into your pipeline. This way, instead of relying on occasional audits, you’ll have daily insights into how code changes impact system latency and throughput [2]. This approach integrates performance testing deeply into your CI/CD workflow, making it part of the team’s daily rhythm.
The key is to combine synthetic monitoring with real-user metrics (RUM). Synthetic monitoring simulates user journeys under controlled conditions, while RUM reflects how actual users interact with your application in the wild. Together, they give you a full picture - controlled benchmarks alongside real-world behaviour.
Implementing Synthetic Monitoring
Synthetic monitoring builds on the automation of quality gates by delivering controlled, repeatable insights. It involves running scripted tests that simulate user actions - like logging in, navigating pages, or submitting forms - on a regular schedule. These tests are typically run against production environments during low-traffic periods, using synthetic test accounts to avoid disrupting real users [2].
For example, tools like k6 can stream performance metrics directly to time-series databases like InfluxDB or Prometheus during test execution [9][4]. From there, you can use Grafana to visualise trends across multiple builds. This real-time observability is invaluable for spotting gradual performance regressions. Imagine your p95 response time slowly increasing from 320 ms to 380 ms over several deployments - synthetic monitoring ensures you catch this before it breaches a critical threshold, like 500 ms.
It’s important to remember that synthetic monitoring complements your staging tests - it doesn’t replace them. By running small, controlled loads against production environments with synthetic accounts, you can validate that your application performs well under actual conditions, not just in a lab-like staging setup.
Adding Real-User Metrics
Synthetic tests provide controlled benchmarks, but they don’t tell the whole story. This is where real-user metrics (RUM) come in. RUM captures how actual users interact with your application, providing insights into traffic patterns, user behaviour, and real-world load conditions.
RUM data is particularly useful for refining your performance baselines and thresholds. For instance, if RUM shows that 95% of users experience response times under 400 ms, but your synthetic tests are calibrated for 320 ms, there’s a clear mismatch. You can adjust your synthetic test scenarios to better reflect real-world conditions. Then, apply a performance ratchet strategy: tighten thresholds as you optimise performance, ensuring it doesn’t quietly regress [2].
To make this work, stream performance metrics from your testing tools into a database. Use Python scripts to parse test result files (like JTL, JSON, or CSV) and extract key metrics such as p95 response time and error rates [2][9]. Automating this process means every deployment feeds fresh data into your thresholds, keeping them accurate and relevant.
Conclusion
Performance testing plays a key role in creating software that's both scalable and reliable. By weaving it into your CI/CD pipelines, you shift from patching issues after they occur to preventing them before they happen. This "shift-left" mindset treats slow response times and connection pool hiccups with the same seriousness as functional bugs.
The strategies outlined here emphasise this proactive approach. Layered testing methods, automated quality gates, and continuous feedback loops make performance testing part of your daily workflow. For example, start with lightweight smoke tests on every pull request to catch glaring issues early, schedule nightly load tests to identify more subtle performance dips, and save stress tests for pre-release validation to ensure your system can handle those inevitable traffic surges without faltering [2]. Each type of test acts as a checkpoint, ensuring performance stays solid throughout development.
Getting started early with performance testing isn't just about avoiding technical headaches - it has real business benefits. Studies show it can cut production issues by up to 30% [1] and help avoid the staggering 53% user abandonment rate caused by poor performance [1]. In other words, it’s not just a technical safeguard; it’s a business imperative.
FAQs
How can I prevent performance tests from slowing down CI?
To keep things moving smoothly, it's smart to integrate performance tests in a way that doesn't slow you down. One great way to do this is by running them in headless mode - this skips the browser interface, saving both time and resources. Pair that with automation, so these tests run with every build, and you're already cutting out manual effort.
You can also use command-line parameters to trim down unnecessary overhead. Want to go even faster? Schedule your tests to run asynchronously or in parallel. This way, you're not waiting for one test to finish before starting the next. And don't forget to set clear pass/fail criteria - this ensures you're not left guessing about whether the build is good to go.
Finally, keep an eye on the key metrics from these tests. The quicker you act on the results, the more useful the tests will be, without throwing a wrench into your deployment process.
What should I set as my first performance thresholds?
Your performance thresholds should reflect what your application aims to achieve and what your users expect. A good place to start might be focusing on response time (say, around 200-300 milliseconds for critical actions), keeping the error rate under 1%, and ensuring throughput can handle the expected volume of traffic. These initial benchmarks act as a safety net, helping you avoid performance dips and maintain a smooth experience for users. Over time, you can tweak these thresholds to match shifting business goals and changing user needs.
How can I ensure performance results are reliable in CI?
To ensure reliable performance results in your CI pipeline, there are a few key things to focus on. Start by designing test scenarios that closely reflect real-world user behaviour. This means thinking about how your users interact with your application and replicating those patterns in your tests.
Next, automate these tests so they run every time a new build is pushed. This keeps things consistent and ensures you’re catching issues early. It’s also crucial to define clear performance goals that align with your business objectives - whether that’s page load time, API response times, or something else entirely.
Another often overlooked factor is the testing environment. Keep it consistent to reduce variability in your results. Variability can make it hard to spot genuine performance issues, so using the same environment setup each time is a must.
Finally, keep an eye on your metrics at all times. If you spot any deviations from your baseline, act fast to investigate and resolve the issue. This proactive approach helps maintain reliability throughout your CI/CD pipeline.