Ultimate Guide to Agile Delivery Metrics
Ultimate Guide to Agile Delivery Metrics
Agile delivery metrics help teams track progress, identify bottlenecks, and improve how work gets done. Unlike old-school methods focusing on scope, schedule, and cost, these metrics prioritise delivering value and improving processes. They’re not about judging individuals or teams but about diagnosing issues to make work smoother and more efficient.
Here’s the gist:
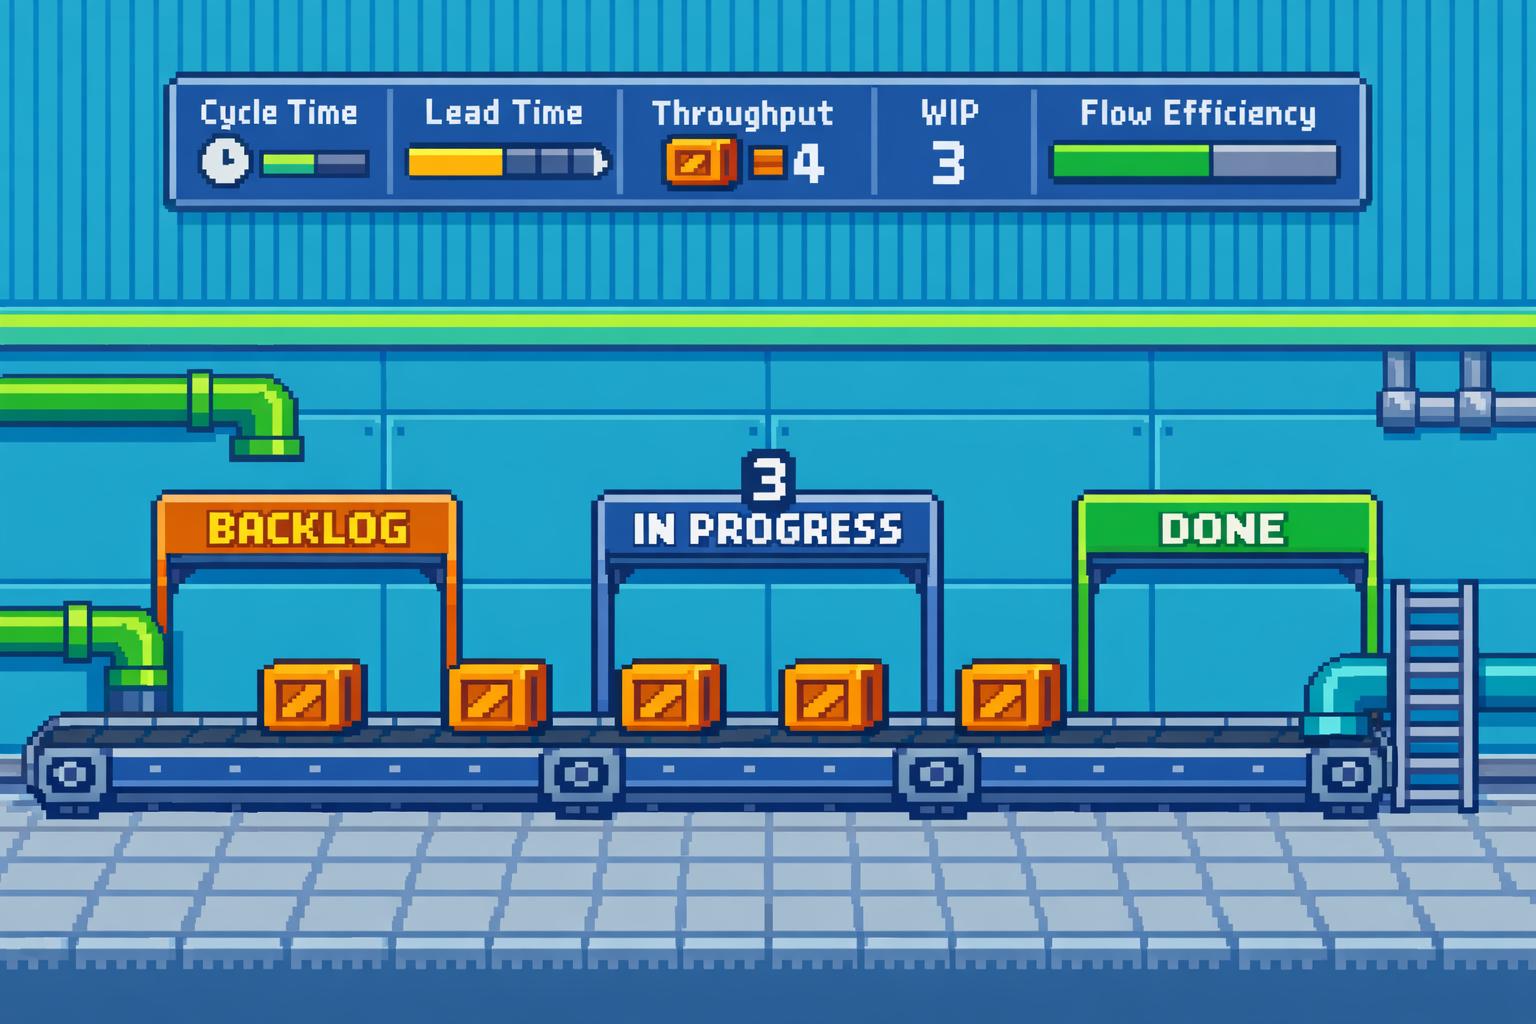
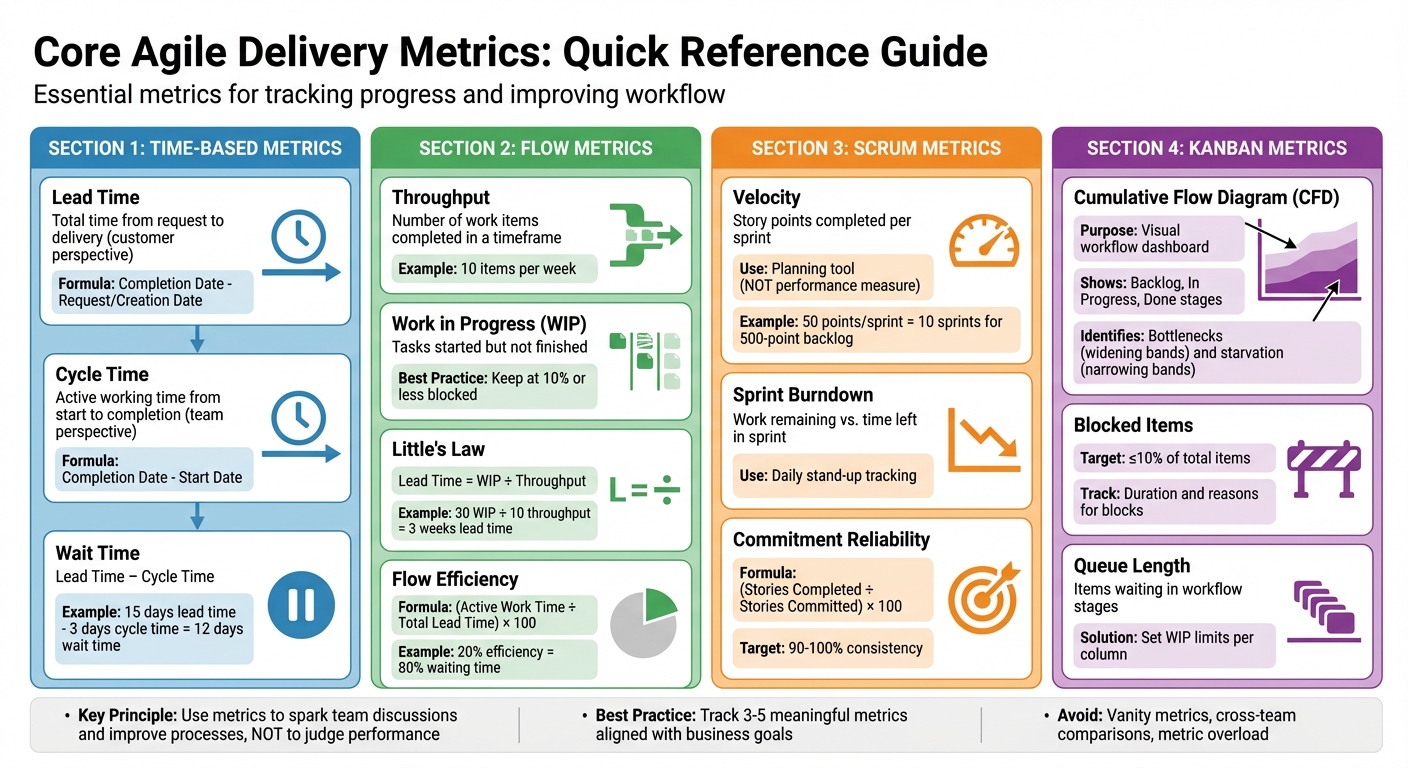
- Cycle Time & Lead Time: Measure how long tasks take to complete (from start to finish or request to delivery).
- Throughput & WIP Limits: Track how much work gets done and how much is in progress to avoid overloading.
- Flow Efficiency: Shows how much time is spent actively working versus waiting.
- Scrum Metrics (Velocity, Burndown): Help with sprint planning and tracking progress.
- Kanban Metrics (CFD, Blocked Items): Focus on continuous flow and spotting bottlenecks.
The key is using these metrics to spark team discussions, not as a stick to measure performance. Keep it simple - track only a few meaningful metrics tied to your goals. Avoid vanity metrics like comparing velocity across teams, and always focus on improving the process, not the people.
Quick Tip: Use retrospectives to dig into what the metrics reveal and make small, targeted changes. For example, if lead times are too long, look at where tasks are getting stuck and experiment with reducing WIP limits.
Want to know more? Let’s dive into the details.
Core Agile Delivery Metrics Comparison Chart
Top Agile Metrics Every Project Manager Should Track | Measure Sprint & Team Performance
Core Agile Delivery Metrics
Agile measurement relies on a handful of key metrics that apply across frameworks like Scrum, Kanban, and Lean. These metrics help you understand workflow and identify bottlenecks.
Cycle Time and Lead Time
These time-based metrics provide insight into both customer experience and team performance.
- Lead Time reflects the customer's perspective by measuring the total time from when a request is made to when it’s delivered.
- Cycle Time looks at the team's active working time, tracking the period from when work begins to when it’s completed.
The difference between these two is Wait Time, which highlights how long tasks sit idle before being worked on. For example, if your Lead Time is 15 days and your Cycle Time is 3 days, that leaves 12 days of waiting - an opportunity to improve.
Here’s how you calculate them:
- Lead Time = Completion Date - Request/Creation Date
- Cycle Time = Completion Date - Start Date
Ian Carroll, a Consultant and Coach at Solutioneers, explains the distinction:
Lead time could be classed as a measure of team maturity and Lead Time as organisational maturity [6].
When forecasting, it’s more reliable to use percentiles (e.g., 85% of tasks are completed within 10 days) rather than relying on simple averages [6].
Throughput and WIP Limits
These metrics focus on work volume and flow efficiency, complementing the time-based metrics.
- Throughput measures how many work items your team completes within a specific timeframe [7].
- Work in Progress (WIP) tracks tasks that have been started but aren’t finished yet. Too many WIP tasks can lead to delays caused by context switching [7].
You can apply Little’s Law to understand the relationship between these metrics:
Lead Time = WIP / Throughput [6].
For instance, if your team completes 10 items per week (throughput) but has 30 items in progress (WIP), the average Lead Time is about 3 weeks. Reducing WIP can help shorten Lead Time.
Setting WIP limits on your Kanban board encourages the team to finish current tasks before starting new ones. This reduces multitasking and makes it easier to spot blockers quickly [7]. To keep things running smoothly, monitor work item age to catch stalled tasks early, and aim for blocked items to stay at 10% or less [1][3][7].
Using throughput run charts can help you track trends in your team’s performance over time. This data is invaluable for sprint planning and milestone forecasting. Unlike velocity, throughput doesn’t rely on estimates and is harder to manipulate, making it a more reliable measure of your team’s actual delivery capacity [7].
Scrum-Specific Metrics
Scrum teams build on core agile metrics by adding specific measures to track sprint progress. These metrics focus on sprint dynamics, helping teams assess delivery and refine their forecasting.
Velocity and Sprint Burndown
Velocity tracks the total story points a team completes during a sprint. It's not about performance; it's a tool for planning. For instance, if your team consistently completes 50 story points per sprint, you can predict that tackling a 500-point backlog will take around 10 sprints. Using a three-sprint rolling average can smooth out any anomalies and improve the accuracy of your forecasts [3][5][1].
"Velocity is not a measure of effectiveness, efficiency, competency... It has one purpose only: to provide the team with a benchmark for estimating and planning how much work it can get done over time."
– Leon Tranter, Extreme Uncertainty [1]
It's crucial to remember that velocity is unique to each team, so comparing it across teams isn't meaningful.
Sprint burndown charts, on the other hand, show how much work is left compared to the time remaining in a sprint. These charts are incredibly useful during daily stand-ups, as they can highlight potential problems early. For example, if the burndown line remains flat or only drops sharply near the end, it might mean tasks are too large and need breaking down. An upward trend, however, could signal scope creep [5].
By keeping an eye on sprint output and improving forecast consistency, teams can gain clearer insights into their workflow.
Commitment Reliability
Commitment reliability, or the planned-to-done ratio, measures how well a team delivers on its sprint commitments. It’s calculated as (Stories Completed / Stories Committed) × 100 [1]. A team consistently hitting 90–100% demonstrates steady and predictable capacity.
If commitment reliability fluctuates, it might point to issues like poor estimation, overly ambitious goals, or external disruptions. Retrospectives are a great way to dig into these problems. Some teams also leave a 10% buffer in their sprint commitments to handle unexpected challenges [8].
"A team that consistently meets its forecast is a compelling advertisement for agile in their organisation."
– Atlassian [5]
Tracking this metric over multiple sprints helps identify trends. For example, regularly under-delivering could mean the team is overcommitting, while finishing too early might suggest they're being overly cautious. Pairing this metric with insights from cycle time and lead time ensures that sprint planning stays aligned with overall process efficiency.
Kanban and Flow-Based Metrics
Kanban takes a different approach from Scrum by focusing on continuous flow rather than fixed sprints. Flow-based metrics are at the heart of this method, providing insights that prioritise smooth delivery and process efficiency. These metrics help teams monitor progress, identify bottlenecks, and address issues before they snowball into larger problems.
Flow Efficiency and Cumulative Flow Diagram (CFD)
Flow efficiency is all about understanding how much of your work time is actually productive. It’s calculated by dividing the time spent actively working on a task by the total lead time (the entire time a task spends in the system) [3][4]. For example, if your flow efficiency is 20%, it means 80% of the time is spent in waiting stages, like tasks sitting in "Awaiting QA" or "Awaiting Definition." This metric is a great way to spot inefficiencies, especially at handoff points, and uncover hidden delays [4].
The Cumulative Flow Diagram (CFD) is like a visual dashboard for your workflow. It uses coloured bands to represent different workflow stages, such as "Backlog", "In Progress", and "Done" [11][3]. The beauty of the CFD is its ability to highlight patterns. If you notice a band growing wider, it means work is piling up in that stage - classic bottleneck. On the flip side, narrowing bands indicate "starvation", where tasks are being completed faster than new ones are added [11][9].
By setting limits on how much work can be in progress and focusing on fewer tasks at a time, teams can cut down on queues and improve how quickly work gets accepted [10].
"The CFD is the Swiss army knife of Agile metrics."
– Tim Metz, Parabol [9]
CFDs aren’t just for show - they’re incredibly practical. During daily stand-ups, they can help flag tasks that are dragging on too long. In retrospectives, they give a bigger picture of long-term trends [10][6]. The horizontal distance between bands shows the average cycle time, while the vertical distance reveals how much work is in progress at any moment [9].
Beyond flow efficiency, keeping an eye on blocked items and queue lengths can help teams zero in on delays and keep things moving smoothly.
Blocked Work Items and Queue Length
Blocked work items and long queues are like red flags for your process. A blocked item is a task that’s stuck - maybe because it’s waiting on a dependency or there’s an unresolved issue [6][9]. By tracking how long tasks stay blocked and categorising the reasons, teams can identify recurring problems and make changes to improve the process [9].
Queue length, on the other hand, shows how many items are waiting in specific workflow stages. For instance, if the "QA" or "Review" column has a growing pile of tasks, it’s a sign those stages are overloaded [10][3]. To prevent this, teams can set Work In Progress (WIP) limits for each column. When a column hits its limit, it forces the team to prioritise and tackle the backlog before taking on new tasks [9].
During stand-ups, it’s worth focusing on items that have been sitting idle longer than the average cycle time. This helps the team quickly resolve bottlenecks and keep things flowing [6]. By regularly monitoring these metrics, teams can nip delays in the bud and maintain a steady, predictable workflow.
sbb-itb-fe42743
Best Practices for Selecting and Using Metrics
Choosing the right metrics can make or break your ability to meet business goals. For instance, if you're aiming to speed up time to market, focus on metrics like cycle time and lead time. On the other hand, if quality is your priority, escaped defects and recidivism rates should take the spotlight [13][14]. By aligning your metrics with your goals and following a few practical tips, you can use them to drive meaningful process improvements.
Align Metrics with Business Goals
Before diving into metrics, take a step back and define what success actually looks like for your organisation. This is where tools like Key Performance Indicators (KPIs) and Objectives and Key Results (OKRs) come into play. They help you track both how you're doing now and where you want to go next [12]. But here's the catch: focus on outcomes, not just outputs. Completing a mountain of tasks might look impressive, but if it doesn’t add value for your customers, it’s just busywork. For example, having high throughput is pointless if your Net Promoter Score (NPS) - a measure of customer satisfaction - takes a nosedive [3][13][15].
A good way to keep things structured is by using the "Goals, Signals, and Measures" framework. Start with your big-picture goals, figure out what signs (or signals) show you’re making progress, and then pick specific metrics to track those signals [2]. Keep your metric list short and sweet - three to five actionable KPIs is usually enough. Cover areas like predictability, productivity, quality, and value. Too many metrics can overwhelm your team and lead to "metric fatigue" - or worse, encourage gaming the system [13][3].
Accountability is another key piece of the puzzle. Assign a clear owner to each metric. For example, a team lead might oversee team happiness, while developers could keep an eye on throughput. This makes sure someone is always responsible for tracking and acting on the data [13][3].
When your goals are clear, picking the right metrics becomes a much simpler task.
Avoid Vanity Metrics
Not all metrics are worth your time. Vanity metrics might look good on paper but don’t provide much actionable insight. Take velocity, for example. It’s easy to inflate through "point drift" - when teams overestimate story points - and comparing velocity between teams is rarely helpful since each team uses different estimation methods [1][6].
Instead, focus on metrics that genuinely reflect your process's health. Throughput, for example, is harder to manipulate than velocity because it encourages smaller, consistent story sizes [1][3]. And don’t forget about quality metrics like escaped defects. These should always be tracked alongside speed-focused metrics like cycle time to ensure you’re not sacrificing quality for the sake of faster delivery.
Once you’ve narrowed down your metrics, the next step is using them to generate meaningful discussions and improvements.
Use Metrics in Retrospectives
Metrics are great for spotting trends, but they’re even more powerful when used as conversation starters. During retrospectives, use them to dig into what’s working and what’s not. Remember, numbers alone can’t tell the full story - it’s the team’s context and insights that bring those numbers to life.
A good starting point is tracking team happiness with a simple 1–5 score. This can act as an early warning sign for burnout before it starts affecting productivity [16]. If you notice issues like a spike in recidivism or longer cycle times, dig deeper using techniques like the "Five Whys" to uncover the root cause instead of pointing fingers [1]. For instance, if your recidivism rate - stories being sent back to development - goes beyond 10–20%, categorise the reasons. Are unclear requirements to blame? Maybe it’s environmental roadblocks or code defects? Once you’ve identified the issue, tweak your process accordingly.
Common Pitfalls and How to Avoid Them
Getting metrics right is crucial, but it's surprisingly easy to fall into traps that can derail progress. One of the biggest issues? Teams often misuse agile metrics. Agile coach Leon Tranter points out that managers sometimes use metrics as a way to "spy on" or judge team productivity, rather than as tools to help teams learn and improve[1]. When metrics are treated like surveillance tools, teams may respond by gaming the system - like inflating story points or marking tasks as "done" prematurely - without actually improving delivery.
Misusing Metrics for Performance Pressure
Focusing on individuals instead of the work itself is a huge mistake. Consultant Ian Carroll puts it bluntly:
NEVER measure people, always measure work[6].
When teams feel the heat from metrics, they often chase the numbers instead of the real goals. This is a classic example of Goodhart's Law in action: When a measure becomes a target, it ceases to be a good measure. Marilyn Strathern summed it up perfectly:
When a measure becomes a target, it ceases to be a good measure[6].
Another problem? Comparing teams against each other. Each team has its own way of estimating work, so a higher velocity in one team doesn’t necessarily mean they’re delivering more value. Metrics should act as tools for learning, not competition. Teams should own their metrics and use them to drive continuous improvement.
While misusing metrics can distort performance, drowning in too many metrics can be just as damaging.
Overcomplicating Metrics
On top of performance pressure, having too many metrics can overwhelm teams. Leon Tranter warns against this:
If you just collect them all, hoping to understand everything at once, you will get overwhelmed and not get anywhere[1].
When teams are buried under piles of data, they risk losing sight of what’s actually important. It’s like trying to drink from a firehose - too much information leads to fatigue and confusion.
The fix? Keep it simple. Stick to a small set of key metrics - ideally a "Top 5" that covers different aspects of delivery[3][4]. For example, you could track:
- Cycle time for responsiveness
- Deployment frequency for predictability
- Escaped defects for quality
- Flow efficiency to pinpoint bottlenecks
- Delivered story points for throughput
Automating data collection through tools like Jira or CI/CD pipelines can save time and let the team focus on what really matters: analysing trends and making improvements[4]. And here’s the good news: you don’t need perfect data. As long as the numbers are good enough to spot patterns, that’s all you need to make meaningful changes[2].
Conclusion and Key Takeaways
Agile delivery metrics aren’t just numbers - they’re like a compass for continuous improvement and aligning your work with broader business goals. Picking a mix of metrics that touch on predictability, efficiency, quality, and value ensures your development efforts stay on track. As the Adobe Communications Team aptly puts it:
Agile metrics are more than just data points. They offer valuable insight into how teams work and where they can improve [17].
The key is to make these metrics part of your regular rhythm. Look at trends over a six-month period, and bring the data into retrospectives to spark meaningful discussions. But remember, metrics should help teams learn and grow, not be used as a stick to measure individual performance. They’re tools for understanding how work gets done, not for judging people [6].
There are some common missteps to watch out for. Don’t lean too hard on a single metric like velocity - teams might start gaming the system. Avoid comparing teams directly, as each team has its own way of estimating and working. And don’t get buried in data; keep an eye out for red flags like low flow efficiency or poor first-time pass rates. These can spotlight areas that need attention and drive genuine improvements.
Strong technical leadership can make all the difference here. Companies like Metamindz offer CTO-led guidance to help tailor metrics to your business goals, ensuring technical efforts align with strategic priorities. With fractional CTO services starting at £2,750 per month, organisations can tap into expertise that boosts innovation by 40% and speeds up product launches by 30% [18].
FAQs
How do Agile delivery metrics enhance team performance without targeting individual productivity?
Agile delivery metrics focus on improving the team's overall workflow and process rather than zeroing in on individual productivity. This shift in focus promotes teamwork, openness, and a mindset of constant improvement within the team.
Metrics like cycle time, lead time, and team velocity are particularly useful. They help organisations spot where things are slowing down, refine processes, and ensure the team stays on track with project objectives. By prioritising these collective measures, teams avoid the risks tied to rewarding individual performance - like unhealthy competition or manipulating numbers - and instead build a sense of shared responsibility.
How do I choose the right Agile metrics for my team?
To pick the right Agile metrics, start by linking them to your team’s specific goals - whether that’s speeding up delivery, improving quality, or increasing predictability. Stick to a small selection of metrics that offer useful insights without bogging the team down. Common examples include sprint velocity, cycle time, and defect rates.
Rather than focusing on one-off numbers, look at trends over time. Combine hard data (like numbers) with softer insights (like team feedback) to get a fuller picture. Use retrospectives to regularly review these metrics, tweak your approach, and keep things moving in the right direction. Make sure the team is involved in the process - this helps avoid unnecessary stress or behaviours that might backfire.
How can retrospectives help teams analyse and improve Agile delivery metrics?
Retrospectives are an essential part of Agile, giving teams the chance to step back, reflect on how they're working, and figure out ways to improve. By diving into metrics like cycle time, throughput, and sprint goals, teams can get a clear picture of their workflows, spot inefficiencies, and tackle bottlenecks head-on. The beauty of using data here is that it keeps discussions grounded in facts rather than veering into subjective territory.
The real magic of retrospectives, though, lies in what you do next. It’s not just about chatting over what went wrong or right - it’s about turning those insights into concrete, actionable steps. Start small. Focus on tweaks that are easy to test and evaluate in the next retrospective. This way, teams can build a habit of continuous improvement, creating a transparent environment where processes get sharper, and outcomes become more reliable and consistent.