Ultimate Guide to Investor-Focused Scalability Metrics
- The Top 3 SaaS Metrics That Drive Your SaaS Valuation | SaaS Metrics School | SaaS Valuation
- Main Types of Scalability Metrics
- How Technology Architecture Affects Scalability Metrics
- How to Present Scalability Metrics to Investors
- How to Implement Scalability Metrics in Your Business
- Key Takeaways for Founders
- FAQs

Ultimate Guide to Investor-Focused Scalability Metrics
When investors look at your business, they’re not just asking how fast you’re growing - they’re asking if your growth can hold up under pressure. Scalability metrics are their go-to tools for this. These metrics show whether your business can grow revenue without costs spiralling or systems breaking down. Think of it like this: scaling from £1 million to £10 million in revenue is great, but if your expenses balloon alongside it, investors won’t be impressed.
Key metrics like Annual Recurring Revenue (ARR), Customer Acquisition Cost (CAC), and Burn Multiple help paint a clear picture of your growth efficiency. For example, a healthy CAC-to-Lifetime Value (LTV) ratio of 3:1 tells investors you’re spending wisely to acquire customers. On the tech side, metrics like uptime and error rates show your systems can handle more demand without falling apart.
Here’s the thing: knowing these metrics isn’t enough. You’ve got to track, improve, and present them in a way that makes sense to investors. Services like fractional CTOs can help you sort out the technical side, ensuring your systems are scalable and your metrics look sharp for funding rounds.
Want to impress investors? Focus on efficient growth, not just fast growth. And make sure your metrics tell a story of sustainability, smart spending, and technical reliability.
The Top 3 SaaS Metrics That Drive Your SaaS Valuation | SaaS Metrics School | SaaS Valuation
Main Types of Scalability Metrics
When investors assess a company’s scalability, they usually focus on three key areas: revenue and growth, unit economics and profitability, and technical and operational performance. Startups often use fractional CTO support to audit these systems. Together, these metrics paint a picture of how efficiently a business can grow. Let’s dive into each category.
Revenue and Growth Metrics
Revenue growth metrics are all about showing that your company is creating value and gaining traction in the market. Two of the most common metrics are Annual Recurring Revenue (ARR) and Monthly Recurring Revenue (MRR), which track predictable, ongoing income. ARR growth rate is calculated as:
(Current ARR – Previous ARR) / Previous ARR[2].
Benchmarks for growth vary depending on the size of the company. For instance, SaaS companies with a £20 million revenue run rate in the top quartile grow at an impressive 123% year-on-year, while the median sits at 78%[2]. Falling below a certain threshold, often referred to as the "Mendoza Line", can make it difficult for startups to attract venture capital[2].
Another key metric is the Magic Number, which measures sales efficiency. It’s calculated as:
(Quarter-over-quarter revenue increase × 4) / Previous quarter’s sales and marketing spend[2].
For SaaS companies, the median Magic Number typically ranges between 0.7x and 0.8x, meaning it takes about 17 months to recoup what’s spent on sales and marketing[2]. While these revenue metrics reveal market momentum, they need to be paired with unit economics to understand how efficiently customers are acquired and retained.
Unit Economics and Profitability Metrics
Unit economics boil down to how much value your business generates for every pound spent. Two critical metrics here are Customer Acquisition Cost (CAC) and Lifetime Value (LTV). CAC is calculated as the total cost of acquiring customers divided by the number of new customers, while LTV is derived from:
Average purchase value × Purchase frequency × Customer lifespan[1].
The LTV:CAC ratio is a favourite among investors, as it shows whether customer acquisition costs are justified. A ratio of 3:1 or higher is considered healthy, meaning that for every £1 spent acquiring a customer, they generate at least £3 in value. For enterprise businesses with varying deal sizes, some investors prefer the simpler Sales Efficiency metric, calculated as:
Net New ARR / Sales & Marketing Spend[2].
Profitability is also reflected in the gross margin, which shows how much revenue is retained after covering the cost of goods sold. It’s calculated as:
(Total revenue – Cost of goods sold) / Total revenue[1].
For SaaS businesses, gross margins of 70% or more are a good sign that the model can scale without costs ballooning.
One increasingly popular metric is the Burn Multiple, which measures how efficiently a company is using its cash. It’s calculated as:
Net burn / Net New ARR[3].
For early-stage companies with ARR between £0–£1 million, the average Burn Multiple is about 3.4, but this improves to 1.4 as ARR grows to £25–£50 million[3]. High-growth startups often have better capital efficiency because their strong net new ARR offsets their burn rate[3]. On average, SaaS startups spend £1.60 for every £1 of net new ARR earned during their journey from seed funding to IPO[3].
Technical and Operational Scalability Metrics
Investors also pay close attention to how well a company’s technical and operational systems can handle growth. Key technical metrics include response times under load, uptime percentages, and error rates, all of which directly affect customer satisfaction and retention.
Operational efficiency is equally important. Ratios like inventory turnover and the sales-to-administrative expenses ratio help gauge how effectively internal resources are managed. These metrics ensure that overhead costs are kept in check as revenue grows[1].
How Technology Architecture Affects Scalability Metrics
The architecture of your technology is a key driver of the scalability metrics that investors care about. How you design, deploy, and maintain your system can either help your metrics thrive as you scale or cause them to crumble under pressure. As Michael Chiaramonte from vFunction aptly puts it:
"A high-performance application might be extremely fast for a single user, but it's not scalable if it can't handle multiple concurrent users" [11].
Architecture Decisions and Their Impact on Scalability
The architectural style you choose has a direct impact on your scalability metrics. Let’s break it down:
- Monolithic architectures: These require you to replicate the entire application stack to scale. This approach can get resource-heavy quickly. For instance, if just one part of your system - like the payment module - becomes a bottleneck, you’re forced to scale the entire application, even if other components don’t need it [8].
- Microservices architectures: These let you scale specific services based on their individual loads. Netflix is a prime example. By moving from a monolithic setup to microservices on AWS, they now handle over 200 billion API requests daily with 99.99% uptime [9][11]. Similarly, Twitter transitioned to microservices using Scala, solving frequent downtime issues and enabling the platform to handle millions of tweets per day [11].
- Serverless architectures: With serverless, cloud providers handle scaling automatically. This can cut operational costs by up to 50% for apps with low or irregular traffic [9]. But there’s a trade-off: "cold start" latency can slow response times during sudden traffic surges [8].
- Event-driven architectures: These decouple producers and consumers, making it easier to handle high loads. Adding more consumers to process event queues improves throughput under heavy stress [8].
Then there’s the classic choice between horizontal scaling (adding more machines) and vertical scaling (upgrading existing hardware). Horizontal scaling is great for unlimited growth and resilience, while vertical scaling is simpler but hits limits in terms of cost and capacity [10][11]. Tools like Kubernetes or AWS Autoscaling can boost load capacity up to fivefold during peak periods [9].
Each of these architectural decisions not only influences system performance but also shapes the operational strategies needed to win investor confidence.
Operational Practices for Demonstrating Scalability
Even the most robust architecture needs solid operational practices to back it up. Investors want proof that your system can keep its promises. Here’s how you can show them:
- Performance baselining: Establish a benchmark for how your system performs today. This lets you track how growth affects key metrics like response time and throughput. For example, a scalable system should handle over 10,000 requests per second during peak traffic while keeping API response times under 100 milliseconds [9].
- Capacity planning: This shows you’re prepared for growth. Monitor CPU and memory usage relative to available resources. Ideally, utilisation should approach but never exceed capacity. Also, measure how quickly new instances or containers spin up - this reveals how fast your system can react to scaling triggers [7].
- Incident management: Investors expect high uptime. Standard systems aim for 99.9% uptime (three nines), while critical systems shoot for 99.99% [9]. Using distributed caches like Redis can reduce database load and improve response times for read-heavy apps [8][9]. Asynchronous processing tools like Kafka or RabbitMQ can offload long-running tasks, boosting throughput and responsiveness [8][9].
By implementing these practices and documenting them thoroughly, you’ll be ready for technical due diligence and investor scrutiny.
How Metamindz Supports Scalable Architecture

When it comes to preparing for technical due diligence, documentation and transparency are non-negotiable. As Heather Abbott from AKF Partners points out:
"Architecture diagrams [are] a foundation for the entire discussion. If the team can't produce any diagrams, it is a clear indicator of level of maturity!" [12].
Investors want to see not just what you’ve built, but the reasoning behind your decisions at each stage of growth [12].
This is where Metamindz steps in. With a CTO-led approach, Metamindz ensures your architectural decisions align with the metrics investors care about. Each engagement includes hands-on guidance and code reviews to ensure your technical choices are up to scratch. Their pre-investment technical due diligence service (£3,750) delivers detailed "tech health" reports, covering everything from architecture diagrams to performance baselines and technical debt management [12][13].
For ongoing support, their fractional CTO monthly subscription (£2,750) provides continuous performance optimisation and architectural oversight. This helps you maintain the practices that keep your scalability metrics strong, ensuring you’re always ready to impress investors with clear, metric-driven narratives.
sbb-itb-fe42743
How to Present Scalability Metrics to Investors
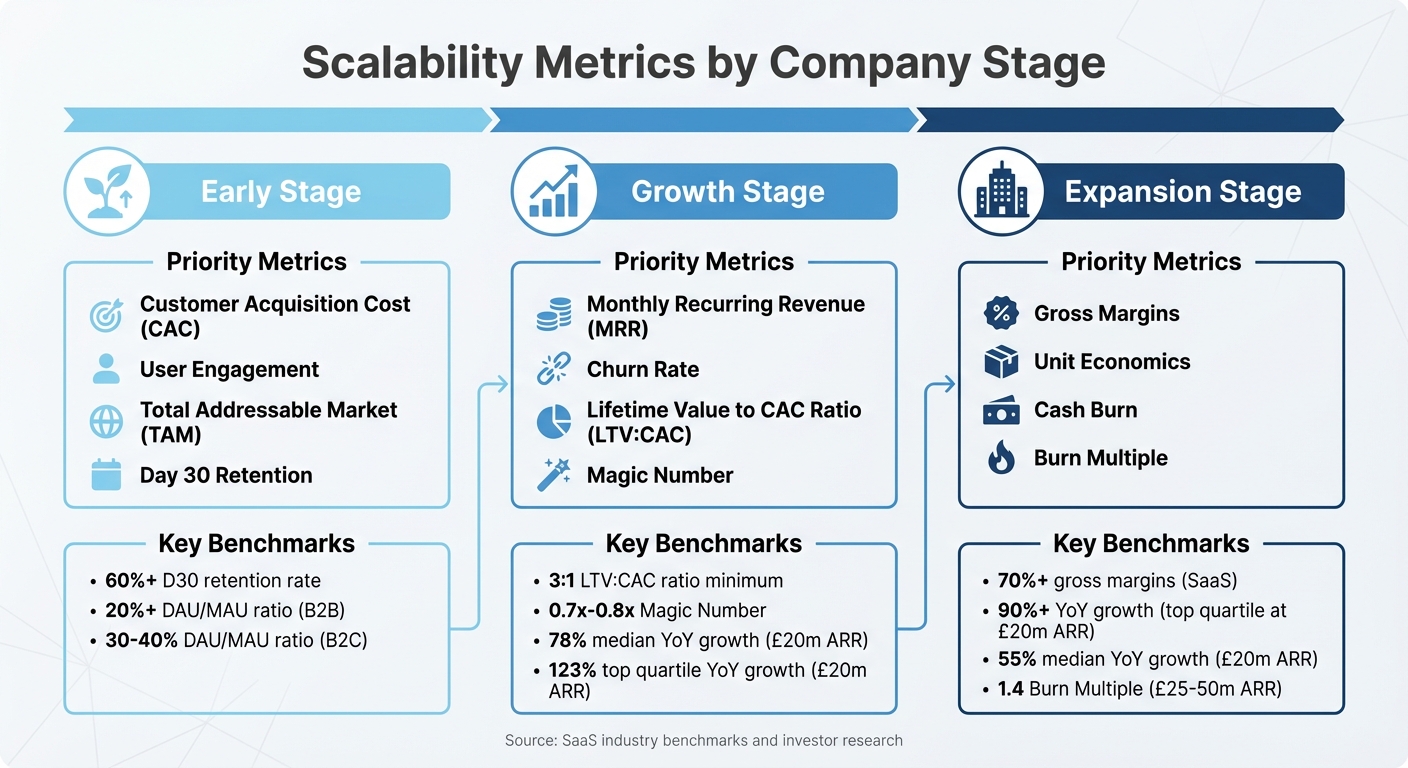
Scalability Metrics by Company Stage: Key Benchmarks for Investors
When presenting scalability metrics to investors, it’s all about showing you can grow efficiently and sustainably. Investors want to know you’ve got a firm grasp on your business fundamentals and a clear plan for scaling without throwing money around recklessly. The trick is to match your metrics to your company’s stage, weave them into a compelling growth story, and be ready for some serious technical grilling.
Choosing the Right Metrics for Your Stage
The metrics investors care about will depend on where your company is in its journey. For early-stage companies (before hitting product-market fit), the focus should be on Customer Acquisition Cost (CAC), user engagement, and Total Addressable Market (TAM). For instance, if you’ve got a Day 30 retention rate above 60% and a DAU/MAU ratio of over 20% (B2B) or 30–40% (B2C), that’s a solid sign you’re on track [15].
When you hit the growth stage, it’s all about proving you’ve got traction and can scale predictably. Metrics like Monthly Recurring Revenue (MRR), churn rate, and Lifetime Value (LTV) become key. A healthy LTV:CAC ratio of at least 3:1 suggests your unit economics are solid, and SaaS companies typically aim for a "Magic Number" between 0.7x and 0.8x [14][15][16][2].
In the expansion stage, the spotlight shifts to profitability and efficiency. Gross margins, unit economics, and cash burn take centre stage. For example, companies with a £20 million revenue run rate should aim for top-quartile year-on-year growth of around 90%, while the median sits closer to 55% [2]. It’s worth noting that 90% of startups fail within five years, often because they get buried under too much data and miss the critical bits [14].
| Company Stage | Priority Metrics | Key Benchmarks |
|---|---|---|
| Early Stage | CAC, User Engagement, TAM, D30 Retention | 60%+ D30 retention; 20%+ DAU/MAU (B2B) |
| Growth Stage | MRR, Churn Rate, LTV:CAC, Magic Number | 3:1 LTV:CAC; 0.7x–0.8x Magic Number |
| Expansion Stage | Gross Margins, Unit Economics, Cash Burn | 90%+ YoY growth (top quartile at £20m ARR) |
Once you’ve nailed down the right metrics, the next step is to tie them into a clear and compelling growth narrative.
Building a Scalability Story That Resonates
Metrics alone don’t tell the full story - they need context. As Rory O'Driscoll from Scale Venture Partners puts it:
"SaaS metrics should be to a management team what patient vital signs are to an emergency room doctor: a simple set of universally understood numbers that allow a doctor to quickly know how ill a patient is and what needs fixing first" [2].
Frame your story around the "Four Vital Signs": Revenue Growth, Sales Efficiency, Revenue Churn, and Cash Burn [2][17]. Highlight trends rather than one-off figures - investors care more about where you’re headed than where you are right now. For example, cutting your churn rate from 8% to 4% over six months shows clear progress on retention.
Transparency is critical. Jess Lee from Sequoia Capital explains:
"Seeing Amplitude dashboards gives me an illuminating glimpse into the founder's brain - how they think about product-market fit, what their obsession metrics are, how they goal their team" [6].
Sharing product usage data clearly shows you’re strategic and trustworthy. And always standardise your calculations - use formulas like the Magic Number:
(Current Quarter GAAP Revenue – Previous Quarter GAAP Revenue) × 4 / Previous Quarter Sales & Marketing Spend [2].
Efficiency matters too. For instance, a company adding £10 million in net new ARR while burning £15 million (Burn Multiple of 1.5) is far more efficient than one adding £5 million while burning £10 million (Burn Multiple of 2.0) [3]. Show that your growth is backed by strong unit economics, not just high spending.
To make things easier for investors, prepare a "Four Vital Signs Tearsheet". This should summarise key data like ARR and P&L figures, along with forward-looking projections based on past performance. Make sure your cash runway is at least 12–18 months [16].
A strong narrative sets the stage for the next step: technical due diligence.
Getting Ready for Technical Due Diligence
Investors will dig deep into your technical setup during due diligence, so every metric needs to be backed by solid technical performance. Any inconsistencies can raise red flags. David Cheng from DCM points out:
"During the due diligence process, if founders share their Amplitude data directly to show us their engagement and retention data and KPIs, it makes due diligence much easier and helps us ensure the metrics are consistent with what is in the fundraising materials" [6].
Prepare detailed documentation - architecture diagrams, funnel visualisations, and cohort retention data - to back up your claims [2][4]. Investors want to see the logic behind your technical decisions at every stage.
This is where Metamindz can be a lifesaver. Their pre-investment technical due diligence service (£3,750) provides a full "tech health" report covering architecture quality, performance, technical debt, security, and scalability. They also give actionable advice to address any risks.
Finally, tailor your presentation to your audience. Angel investors might be drawn to your vision and willing to take more risks, while venture capitalists will focus on scalability, returns, and detailed metrics [14]. Whatever you do, don’t fudge the numbers - investors can spot inconsistencies a mile away, and trust is hard to rebuild once it’s lost [5].
How to Implement Scalability Metrics in Your Business
Once you've validated your scalability metrics for investors, the next step is weaving them into your day-to-day operations. This means ensuring your finance, product, and engineering teams are aligned, speaking the same language, and working towards shared goals. The trick? Keep it simple, standardise your approach, and make sure every metric has a clear owner.
Choosing Metrics and Data Sources
Start by identifying the metrics that truly matter and pin down where your data will come from. A good starting point is the "Four Vital Signs" we covered earlier: Revenue Growth, Sales Efficiency, Revenue Churn, and Cash Burn [2]. These are straightforward and universally understood, making it easier to assess performance without drowning in unnecessary complexity.
It’s crucial to standardise how metrics are defined across teams. For example, if your finance team calculates Customer Acquisition Cost (CAC) one way, but the product team uses a different method, you’ll end up with conflicting reports and wasted effort. A consistent approach - like adjusting CAC payback for gross margins - ensures fair comparisons across business units [5]. Your main data sources will likely include P&L statements, ARR reports, CRM data, and product usage analytics [18][6].
When comparing performance, benchmark by ARR band. For instance, a 50% growth rate at £100 million ARR is impressive, but the same rate at £1 million ARR might be underwhelming [3]. Always compare yourself to businesses of a similar size to make your metrics meaningful. This consistency creates a solid foundation for reliable measurement and reporting across the organisation.
Setting Up Measurement and Reporting
Once you’ve chosen your metrics, you’ll need a system to track and present them clearly. The goal? A "single pane of glass" where stakeholders can quickly gauge performance [18][21]. Tools like Scale Studio provide features such as a "Four Vital Signs Tearsheet" and "Board Benchmark Slides" tailored for founders to share key metrics with their board [18]. On the engineering side, platforms like Plandek integrate APIs to overlay financial, HR, and customer data (like Net Promoter Score) with engineering metrics (such as Deployment Frequency), giving you a clearer picture of how delivery impacts customer satisfaction [21].
Timely reporting is non-negotiable. For example, when evaluating Sales Efficiency, compare the current quarter’s Net New ARR with the same quarter’s Sales & Marketing spend. Delays or added lags can muddy the waters and lead to excuses or misinterpretations [2]. As David George, Sarah Wang, and Alex Immerman from a16z Growth caution:
"It's easy to fall prey to confirmation bias and manipulate your numbers to tell the story you want to hear... a practice that can trickle down to the rest of your organisation and create a culture of numbers-gaming" [5].
Set a clear reporting cadence - weekly updates for internal teams, monthly summaries for leadership, and quarterly deep dives for your board. Make sure the data is accessible and easy to digest. Jess Lee from Sequoia Capital underscores the importance of this:
"Seeing Amplitude dashboards gives me an illuminating glimpse into the founder's brain - how they think about product-market fit, what their obsession metrics are, how they goal their team" [6].
Transparency is key. It builds trust internally and with investors. Keep a record of nine key data points over the last eight quarters to provide enough historical context for spotting trends and making informed decisions [2]. This approach also simplifies technical due diligence, showcasing your scalability to investors.
Improving Metrics Through Regular Review
Tracking metrics isn’t enough - they need to drive action. Regular reviews help you stay proactive. As Mark Chiaravalloti, Founder of Vision Strategies, puts it:
"Scaling requires ownership. If no one owns the outcome, nothing scales" [20].
Assign ownership for each metric - whether it’s your Sales Manager, Operations Manager, or IT Manager. For example, during his presidency at a company, Mark implemented a stage-gate process for all initiatives, assigning clear ownership to each milestone. This approach helped reverse a 20% revenue decline into over 35% growth [20].
Set regular review cycles to evaluate performance and identify areas for improvement. Let’s say your Net Revenue Churn is at 21% - the median for companies with a £20 million revenue run rate [2]. You could aim to bring it down to 15% over the next two quarters. Break that goal into actionable steps, like improving onboarding, resolving customer complaints faster, or introducing features that boost retention. Monitor progress monthly and tweak your strategy based on what’s working.
Ditch vanity metrics that don’t lead to action. Focus on KPIs that genuinely reflect customer satisfaction and operational efficiency [20]. For instance, if your Burn Multiple is higher than industry benchmarks, it’s a red flag that needs immediate attention [3]. Data shows that high growth and efficiency often go hand in hand, so keeping your multiples in check is critical [3].
Lastly, create feedback loops. Regularly gather input from your teams and customers through surveys or feedback sessions. This will help you adjust your scaling strategies in real-time [19]. Keeping your metrics relevant ensures your business stays on track and helps you catch potential problems before they escalate. By embedding these practices, you align your operational performance with the scalability that investors value.
Key Takeaways for Founders
Scalability metrics are like your business's health check - they tell you if you're ready to grow or if there are cracks in the foundation. By keeping a close eye on the Four Vital Signs - Revenue Growth, Sales Efficiency, Revenue Churn, and Cash Burn - you’re aligning with the metrics that Limited Partners (LPs), venture capitalists (VCs), and potential acquirers care about most. This not only builds trust but also speeds up the due diligence process when it matters most [4][6].
Here’s a sobering thought: 70% of failed startups blame premature scaling on poor metric discipline [4]. Even companies that nail product-market fit aren’t safe - 78% still fail to scale because they rely too heavily on founder-led processes [22]. The lesson? Tracking your metrics rigorously is non-negotiable. Investors, for example, are laser-focused on retention. As Turner Novak from Banana Capital puts it:
"customers coming back over and over shows how well the core product is working" [6].
Retention is king, and efficient burn multiples are the crown jewels. These are the signals that investors look for to differentiate between real, sustainable growth and vanity metrics that don’t hold up under scrutiny.
But don’t stop at metrics. If your technical architecture isn’t scalable, you’re setting yourself up for trouble. A shaky infrastructure makes it nearly impossible to measure the things that matter. Services like Metamindz, led by experienced CTOs, can help you build the right architecture and data systems so you’re not flying blind. This way, your metrics reflect reality, and your systems can handle the growth you’re working toward.
The mantra here is simple: what gets measured gets managed. Start small - focus on five to ten key metrics, assign clear ownership to team members, and review them weekly [4]. Always have a “metric pocket list” handy for investor meetings. Better yet, go one step further with live dashboards. BeReal’s CEO, for instance, used Amplitude dashboards to share real-time data during their rapid scaling phase, which reinforced transparency and built investor confidence [6]. Showing you’ve got nothing to hide builds trust - and trust is what gets funding over the line.
FAQs
What scalability metrics do investors prioritise?
Investors tend to zero in on four main metrics when gauging a company's ability to scale and grow:
- Growth: This is all about how fast your business is expanding. Metrics like year-on-year (YoY) annual recurring revenue (ARR) or revenue growth paint a clear picture of your momentum.
- Burn: Here, metrics like the burn multiple and the Rule of 40 come into play. These help evaluate whether your growth is balanced against your spending - essentially, are you scaling without burning cash irresponsibly?
- Churn and Retention: Gross churn and net revenue retention (NRR) are key to understanding customer loyalty. They show how well you're holding onto your customers and whether you're able to increase revenue from your existing base.
- Efficiency: Sales efficiency metrics, like the magic number, shed light on how well your sales and marketing efforts are converting into actual revenue. It’s about making sure every pound spent is pulling its weight.
Getting a handle on these metrics is more than just a numbers game - it’s about proving your business has what it takes to grow sustainably. Plus, it’s a surefire way to boost investor confidence in your long-term prospects.
How does a technology architecture influence scalability?
A strong technology architecture is the foundation for scaling up, enabling applications to manage heavier workloads without sacrificing performance or efficiency. Whether it's through horizontal scaling (adding more machines) or vertical scaling (upgrading existing ones), the right setup ensures steady response times, efficient resource use, and smart cost management - metrics that investors keep a close eye on.
Why do investors care so much about scalability? Because it shows that a system can grow steadily while staying reliable. A well-thought-out architecture doesn't just meet today's needs; it’s built with tomorrow in mind, making it a crucial ingredient for long-term success.
Why do investors value the LTV:CAC ratio?
The LTV:CAC ratio is a vital metric for investors. It compares the lifetime value (LTV) of a customer - essentially, the revenue a customer brings over their entire relationship with a company - to the cost of acquiring that customer (CAC). In simpler terms, it shows whether the money spent on getting a customer is worth it in the long run.
A solid LTV:CAC ratio signals that a company has balanced its costs and revenue well, which is essential for growth and profitability. This metric gives investors a clear picture of whether a business can scale efficiently while keeping healthy profit margins, making it a key consideration when deciding whether to invest.