Ultimate Guide to Tech Team Performance Metrics

Ultimate Guide to Tech Team Performance Metrics
Tech team performance metrics help you measure how well your software development process is running. They focus on team-level outcomes like deployment frequency, cycle time, and code quality rather than individual productivity. The goal? To improve delivery speed without sacrificing reliability.
Here’s the gist:
- Why metrics matter: They provide measurable progress, boost developer morale, and align technical work with business goals.
- Choosing the right metrics: Focus on actionable ones that tie back to business objectives. Avoid vanity metrics like lines of code.
- Examples: Use DORA metrics (e.g., deployment frequency, change fail rate) and balance speed with quality.
- Implementation tips: Automate data collection, keep metrics simple (5–7 key ones), and ensure they’re within the team’s control.
- Avoid common pitfalls: Don’t micromanage or misuse metrics to judge individuals. Context and team-level focus are key.
Software engineering: Metrics that matter
How to Choose the Right Performance Metrics
Tech Team Performance Metrics: Business Outcomes vs Technical Metrics Comparison
Connecting Metrics to Business Goals
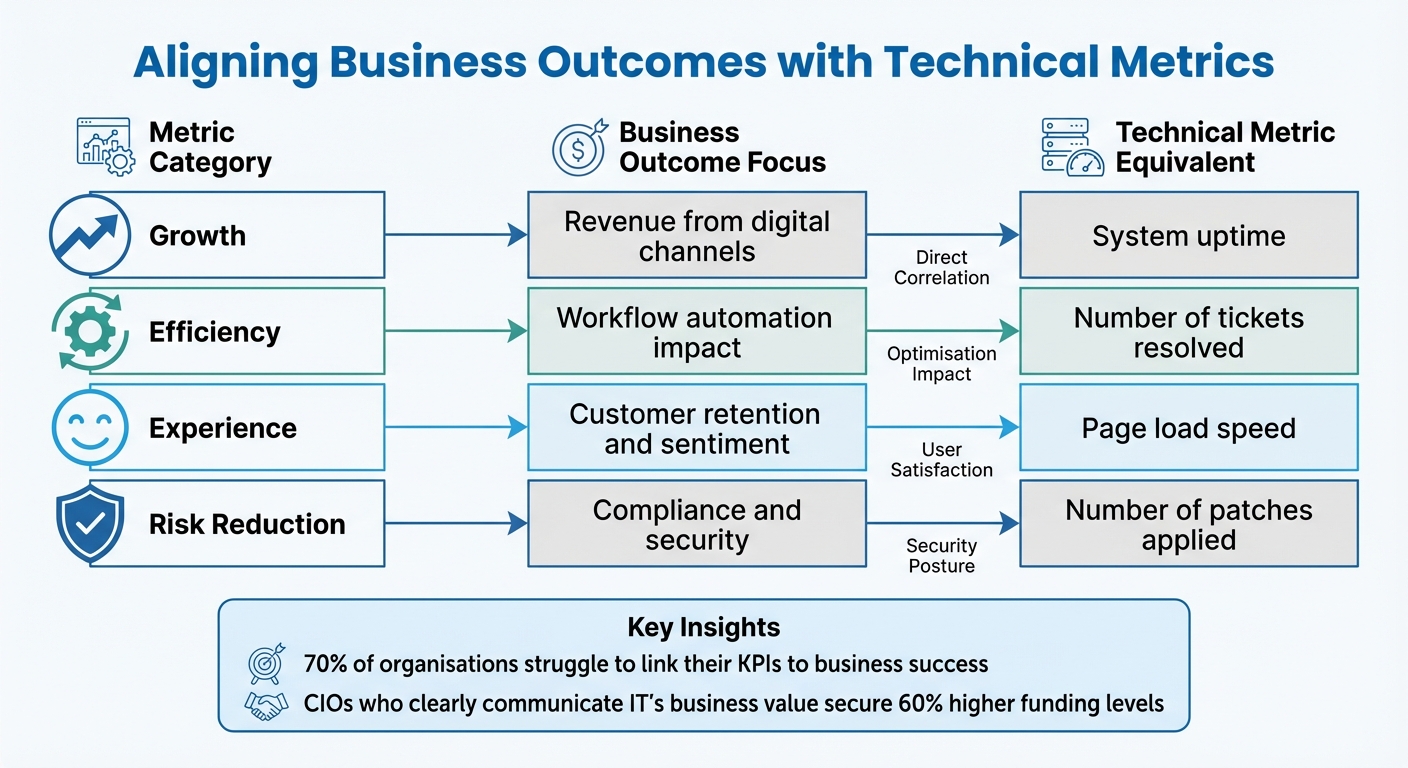
It’s tempting to pick metrics that look impressive on a dashboard, but if they don’t align with your business goals, they’re just noise. In fact, 70% of organisations struggle to link their KPIs to business success, and 68% track more than 10 KPIs, which scatters focus [11]. The solution? Always start by understanding the "why" behind each objective.
Your IT team needs more than just deadlines and technical specs - they need the business context. Let’s say you’re rolling out a feature by a specific date. Share the bigger picture: maybe it’s about capturing market share or hitting quarterly revenue targets [10]. From there, break down these high-level goals into actionable tech tasks. For example, if boosting revenue is the aim, prioritise projects like improving website usability or upgrading customer support tools [10].
Here’s a handy trick: apply the "So What" Test to every metric. Ask yourself, “So what?” If the answer doesn’t directly tie back to business value, ditch it [9]. Metrics are only useful if they drive action - if a change in the number doesn’t spark a decision or discussion, it’s not worth tracking [2][4].
Another must-have is the "Control Test". Your team should have real influence over the metrics they’re being measured against [9]. For example, judging engineers by company revenue doesn’t make sense - it’s influenced by factors like market trends and sales efforts. Instead, stick to metrics they can directly impact.
"Value exists in the eye of the consumer - that is, of the business stakeholder - not of the provider, or IT department." – Verticomm [11]
Here’s a compelling stat: CIOs who clearly communicate IT’s business value secure 60% higher funding levels than those who don’t [11]. Use Quarterly Business Reviews (QBRs) to align with leadership on infrastructure, budgets, and strategy. This keeps everyone on the same page and ensures your metrics evolve with business priorities - something only 40% of organisations do consistently [11].
Once you’ve nailed down business alignment, the next step is choosing metrics that reflect and drive those goals.
Common Metrics for Tech Teams
Now that you’re clear on the business goals, it’s time to pick the right metrics. The DORA framework is a go-to for tech teams, focusing on five core metrics: Change Lead Time, Deployment Frequency, Failed Deployment Recovery Time, Change Fail Rate, and Deployment Rework Rate [1]. For elite teams, a change lead time under a day and a failure rate between 0% and 15% are benchmarks to aim for [2].
But remember, it’s not just about speed - it’s about balance. Pair throughput metrics (like features shipped) with quality metrics (like change fail rate) to avoid unintended consequences [9]. If you only track velocity, you risk teams cutting corners to hit deadlines. Quality and quantity need to go hand in hand.
Here’s a quick look at some effective metrics:
| Metric Category | Business Outcome Focus | Technical Metric Equivalent |
|---|---|---|
| Growth | Revenue from digital channels | System uptime [11] |
| Efficiency | Workflow automation impact | Number of tickets resolved [11] |
| Experience | Customer retention and sentiment | Page load speed [11] |
| Risk Reduction | Compliance and security | Number of patches applied [11] |
It’s also important to understand the difference between leading indicators and lagging indicators. Leading indicators, like cycle time or WIP limits, help predict outcomes and allow for quick adjustments. Lagging indicators, such as deployment frequency or defect density, confirm past performance [1][2][9]. A good balance is about 60% lagging and 40% leading indicators [9].
To keep things manageable, aim for a “sweet spot” of 5 to 7 core KPIs, with a maximum of 8 to 12 [2][4][9]. Tracking too many metrics just creates confusion. Focus on what’s most relevant to your team’s specific goals.
And while picking the right metrics is crucial, knowing what to avoid is just as important.
How to Avoid Vanity Metrics
Vanity metrics might look good on a report, but they rarely lead to meaningful action. Classic examples include lines of code, commit frequency, and individual productivity scores [2][3][6]. These often encourage bloated, low-quality work and can foster a toxic culture.
"The real trade-off, over long periods of time, is between better software faster and worse software slower." – Dave Farley [1]
Beware of Goodhart’s Law, which states that when a measure becomes a target, it stops being a good measure [1]. For instance, setting “deploy 5 times a day” as a hard target can lead teams to game the system, prioritising the number over actual value.
Using team-level metrics to evaluate individual performance is another trap [3][8][7]. Metrics like velocity and cycle time are meant to improve processes, not to micromanage people. Misusing these metrics can lead to finger-pointing and discourage teamwork.
Also, avoid comparing apples to oranges. Metrics from vastly different systems - like a mobile app and an old mainframe - aren’t directly comparable [7][1]. Instead, use historical data from your own team to set realistic targets [2][9].
Finally, don’t ignore the bigger picture. Metrics often fail when they overlook things like technical debt, mentoring, or shifting priorities [3][9]. For example, a drop in velocity might mean the team is investing in long-term improvements, not slacking off. Context matters, so always dig deeper before jumping to conclusions.
How to Implement Performance Metrics
Setting Up Measurement Processes
Once you've identified the metrics that align with your goals, the next step is to automate their collection. Tools like GitHub, GitLab, Jira, Trello, or Datadog can handle this for you, removing the need for manual data entry. Let's be honest - nobody enjoys manually inputting data, and it often leads to errors or a flood of unnecessary metrics that can overwhelm the team and kill engagement.
Start by establishing baselines for your metrics. For example, look at deployment frequency, lead time, or failure rates. If your team currently takes two weeks to deploy changes, that's your starting point - even if the industry’s top performers are deploying in under a day. It's about improving from where you are, not where others are.
Focus on team-level outcomes rather than individual performance. Metrics like deployment frequency or change failure rates encourage collaboration and a shared sense of responsibility across the team.
Get performance analysts involved early on to ensure metrics are seamlessly integrated into your existing tools and workflows. Avoid building custom solutions from scratch unless absolutely necessary. Instead, consolidate everything into a single, easy-to-read dashboard that pulls together commits, tests, and deployments. This makes it simple for everyone to stay on the same page.
Here’s a suggested timeline for rolling out your metrics programme:
| Implementation Phase | Activities | Timeline |
|---|---|---|
| Phase 1: Design | Define roles, map outcomes to metrics, and choose tools. | Weeks 1–2 |
| Phase 2: Alignment | Share drafts with the team, gather feedback, and confirm data sources. | Weeks 3–4 |
| Phase 3: Launch | Finalise metrics, set up dashboards, and schedule the first review. | Week 5 |
| Phase 4: Management | Conduct monthly reviews and quarterly performance discussions. | Ongoing |
Once you've got the data flowing, the next challenge is making sure the team understands and uses it effectively.
How to Present Metrics to Your Team
To build transparency and shared accountability, make metrics visible in places where the team can easily access them - like office screens, Slack channels, or during daily stand-ups. This keeps everyone aligned, whether they're in development, operations, or product management.
When you introduce new metrics, tie them directly to business outcomes. For instance, if you're tracking deployment frequency, explain how faster deployments can lead to quicker customer feedback and potentially boost revenue. A good example: 39% of developers see code quality as their primary measure of work quality[3]. So, present metrics as tools to help the team improve, not as a way to scrutinise individual performance.
Keep it simple - stick to five to seven key metrics. If a particular metric doesn’t drive action, drop it. As Ante Baus, Chief Delivery Officer at DECODE, wisely puts it:
"If a metric won't change how you work, it's not worth tracking"[2].
Strike a balance between different types of metrics. For example, pair efficiency metrics (like deployment frequency) with quality metrics (like change failure rates) to ensure speed doesn’t come at the cost of quality. When metrics fluctuate, use it as an opportunity to ask meaningful questions: Why are code reviews taking longer? or What helped improve our mean time to restore this week? Avoid using metrics to assign blame - focus on learning and improving instead.
Presenting metrics clearly and thoughtfully lays the groundwork for turning insights into action.
Making Metrics Actionable
Metrics are only useful if they lead to change. Automate alerts for unmet objectives - like code reviews that have been pending for over 24 hours - to keep the team on track without needing constant manual follow-ups.
Introduce work-in-progress (WIP) limits to minimise context switching and highlight bottlenecks. For example, you might cap development tasks at eight items. This forces the team to finish what’s already in progress before taking on anything new, keeping the workflow smooth and manageable.
Consider setting up error budgets to define acceptable failure thresholds. If these thresholds are exceeded, pause new feature development and focus on stabilising the system. This approach provides a clear, actionable response to quality issues without endless debates.
Finally, schedule regular reviews - monthly or quarterly - to look at trends and tweak your metrics as priorities evolve. As your team grows and improves, you can shift from tracking basic efficiency measures to more advanced indicators of value delivery. The key is to keep refining the process so it always serves your team’s goals.
sbb-itb-fe42743
How to Analyse and Interpret Performance Metrics
Spotting Trends and Patterns
Once you've set up your metrics and shared them with your team, the next step is to dig into the data, make sense of it, and, most importantly, act on what you find. Numbers on their own don’t mean much - it’s the context that brings them to life. A good way to organise your metrics is by grouping them into three categories: Process (efficiency), Product (quality and functionality), and People (productivity and satisfaction). This helps you spot trends more effectively[19].
For example, imagine your deployment frequency suddenly drops from a steady twice a week to once every two weeks. That’s a red flag worth investigating. On the other hand, small variations - like moving between one and three deployments per week - are usually nothing to worry about[17][18].
When identifying trends, it’s better to focus on predictive metrics, such as how quickly code reviews are completed, rather than confirmatory ones like uptime or revenue figures. Predictive metrics give you a heads-up about potential issues before they become full-blown problems. For instance, elite IT teams often keep their Mean Time to Resolve (MTTR) under an hour, while high-performing support teams aim for a median first response time of around 1.8 hours[3]. Use these benchmarks as a guide, but remember, the real goal is improving from where you are now - not trying to match someone else’s numbers.
Pay attention to patterns that could signal bottlenecks. Let’s say error rates consistently spike on Tuesday afternoons, or support tickets pile up every time sprint planning rolls around. These could be signs of underlying workflow issues[14][17]. Context matters, too - a jump in error rates during a major infrastructure migration makes sense, but the same spike during a routine maintenance period is a cause for concern[19].
To stay on top of things, establish a solid review rhythm. Weekly check-ins can help you catch early warning signs, while monthly reviews are better for analysing trends in detail. For long-term planning and strategy, quarterly sessions work best[15][17].
"KPIs should start conversations, not end them."
And don’t just stop at the numbers. Combine your findings with qualitative feedback to understand why the metrics look the way they do.
Combining Numbers with Qualitative Feedback
Numbers can point out problems, but they won’t tell you the whole story. That’s where qualitative feedback comes in. For instance, a drop in sprint velocity might seem alarming - until you learn through a quick chat that the team intentionally slowed down to tackle technical debt or that a key developer left mid-sprint[9].
To strike the right balance, consider using a weighted scorecard. Allocate around 60–70% to quantitative outcomes (like deployment frequency or error rates) and 30–40% to qualitative factors (such as teamwork or problem-solving)[9]. This ensures you’re not prioritising speed over quality or team morale.
Gather feedback from multiple sources - peer reviews, 360° assessments, and manager observations all provide valuable perspectives[3][9]. For example, a developer with fewer commits might actually be spending their time mentoring junior team members, a contribution that traditional metrics often overlook.
To make subjective assessments more consistent, use structured rubrics with four or five proficiency levels (e.g., Developing, Proficient, Advanced, Expert)[9]. Pair these qualitative insights with quantitative data to get a fuller picture. For instance, instead of just tracking "Features Shipped", also measure "Bug Rate" or "Stakeholder Satisfaction" to ensure quality isn’t sacrificed for speed[9].
It’s also worth noting that engaged IT staff are not only 21% more productive but also 59% more likely to stick around[3]. Keep an eye on qualitative signals like cognitive load, flow states, and psychological safety - these can have a huge impact on your team’s performance.
"For effective performance evaluation, combine quantitative tracking metrics with qualitative assessments. Focus on employee development and growth rather than punitive measures."
Once you’ve got a mix of trends and feedback, the next step is turning those insights into actionable improvements.
Turning Metrics into Improvements
Here’s a simple test to make sure your metrics are driving real change: ask yourself, “So what?” If a metric doesn’t tie back to business value, it’s probably not worth tracking[9]. Stick to 5–7 key indicators that genuinely matter - too many metrics can overwhelm your team and lead to inaction[15][3].
When presenting metrics, try reframing technical terms in a way that resonates with stakeholders. For example, instead of saying “deployment frequency,” you could say “faster feature delivery.” It’s the same data, but it highlights the business impact[15]. This approach works - companies that focus on customer experience metrics see 41% higher revenue growth and 49% faster profit increases[16].
If you notice something like an increase in code review times, don’t just let it slide. Dig deeper and look at related metrics like defect density. The goal is to maintain quality while improving speed[2].
Set SMART goals (Specific, Measurable, Attainable, Relevant, Time-bound) based on your analysis[18][19]. For example, if your change failure rate is 25% and elite teams aim for 0–15%[2], you could set a goal to reduce it to 18% within three months by implementing automated testing. Break larger metrics into smaller, actionable parts. For instance, if you’re tackling latency issues, separate image loading times from credential validation to pinpoint the exact problem[20].
Make trends visible to the whole team using real-time dashboards in tools like Jira, Grafana, or Datadog. This transparency helps everyone stay on the same page and spot issues early[3][17].
"Effective metrics aren't just numbers; they're narratives that tell a story about your progress."
Visual tools like cumulative flow diagrams can also be a game-changer. If tasks are getting stuck in the "testing" phase, you’ve likely found a bottleneck that needs addressing before it becomes a bigger issue[13].
Common Challenges and Best Practices
How to Avoid Micromanagement
One of the quickest ways to kill team morale is by turning metrics into a weapon rather than a tool for guidance. For instance, obsessively tracking individual performance - like counting how many lines of code a developer writes or how many commits they make daily - creates a culture of surveillance. This kind of micromanagement stifles creativity and teamwork. Plus, these so-called "vanity metrics" don’t actually reflect the real value being delivered and can result in bloated, inefficient codebases[3].
A much better approach is to focus on team-level outcomes instead of individual stats. This shift encourages psychological safety and shared accountability - both of which are crucial for high-performing teams. Think about it: developers already spend about 11% of their day on Slack and 12.5% in meetings[4]. Team-level metrics capture the less visible but equally important work, like mentoring, sharing knowledge, and tackling complex challenges that keep everything running smoothly.
"The real trade-off, over long periods of time, is between better software faster and worse software slower." - Dave Farley[1]
Another important point is to ensure metrics are within the team’s control. If a team has no influence over the numbers they’re judged by, frustration is inevitable. For example, tracking deployment frequency is pointless if the team doesn’t control the release schedule - it’ll just feel demoralising. Pairing speed metrics (like Velocity) with quality metrics (like Defect Density) is also a smart move. This creates a healthy balance, preventing teams from cutting corners just to meet speed targets.
Avoiding micromanagement is a great way to keep morale high, but it’s equally important to ensure your metrics are accurate. After all, poor data leads to poor decisions.
Keeping Metrics Accurate
Bad metrics are worse than having no metrics at all - they lead to misguided decisions and wasted effort. A common problem is overlooking the context behind the numbers. For example, raw data often misses crucial activities like mentoring or dealing with shifting priorities[3][4]. To minimise errors, automate data collection wherever possible using tools like Jira or GitHub. Automation ensures consistency and reduces the risk of human error.
When presenting daily graphs, exclude weekends to avoid misleading dips or spikes in the data. Likewise, log events based on when they’re completed, not when they started, to avoid having to awkwardly rewrite history. For teams spread across multiple time zones, standardise "business days" to 8 hours to keep comparisons fair.
Metrics that don’t account for quality are missing a huge piece of the puzzle. Combine quantitative metrics with qualitative feedback from 1-on-1s and retrospectives to get a fuller picture. For instance, if you notice a spike in cycle time, it could be due to a major refactoring effort rather than a drop in productivity.
As your team grows and evolves, so too should your metrics.
Updating Metrics Over Time
Metrics aren’t a "set it and forget it" kind of thing - they need to evolve as your team matures. A new team might need indicators like lead time to get up to speed, while a more experienced team might shift focus to managing technical debt[2][12]. Regularly reviewing your metrics - say, monthly or quarterly - helps ensure they still align with your goals.
Here’s a practical tip: use short-term metrics for specific initiatives and retire them once the goal is achieved. This keeps your dashboard clean and your team focused on what’s important right now. For example, if you’re working to reduce your change failure rate from 25% to 15%, track it closely during that period. But once you’ve hit the target, move it to a secondary dashboard.
Keep your top-tier metrics limited to 5–7 key performance indicators (KPIs)[2][5]. Tracking more than 12 creates unnecessary noise and makes it harder to prioritise actions. As Ante Baus, Chief Delivery Officer at DECODE, wisely says:
"If a metric doesn't drive action or start a discussion, drop it."[2]
Finally, beware of falling into the trap of Goodhart’s Law: "When a measure becomes a target, it ceases to be a good measure." In other words, if teams start gaming the system just to hit numbers, the metrics lose their value. Use them to pinpoint process bottlenecks, not to police individuals. This way, metrics remain a tool for continuous improvement rather than a source of blame.
Conclusion: Using Metrics to Drive Team Growth
Key Takeaways
Performance metrics act as a compass, helping your team focus on building the right products efficiently [15][21]. They create a shared understanding between engineering and business, connecting technical progress to results like quicker feature rollouts [15]. By concentrating on team-level metrics instead of individual ones, you can minimise micromanagement, encourage accountability, and strengthen collaboration - all of which contribute to better retention [3].
It's important to pair the numbers with the story behind them. Balancing quantitative data with qualitative insights offers a fuller picture of what’s driving the outcomes [3][24]. Focus on input metrics - things your team can directly control, like breaking down work into smaller tasks - to influence output metrics, such as shorter lead times [20].
"The most effective metrics are those that help teams empathise with customers and inspire measurable results" – Tim Kohn, Technologist-in-Residence at Summit Partners [20].
Keep things simple: stick to 5–7 core KPIs to avoid drowning in data and losing focus [2][15][21]. High-performing teams often achieve a Mean Time to Resolve (MTTR) of under one hour and keep change failure rates between 0% and 15% [3][2]. But remember, progress is more important than hitting perfection. Celebrate small wins - like cutting MTTR from 4 hours to 3 - to encourage a mindset of continuous improvement, rather than obsessing over fixed benchmarks [15].
The goal is to make metrics part of your team’s daily rhythm.
Next Steps for Your Team
Here’s how you can put this into action: Start by identifying your business objectives. Break them down into specific engineering goals that align with your strategy [25]. Use tools like GitHub, Jira, or CI/CD pipelines to automate data collection, ensuring accuracy while saving time on manual tasks [23][3][4]. Before setting targets, document your current performance to establish a baseline [3].
Make it a habit to review your metrics every quarter. This keeps them relevant as your business priorities evolve [2][15]. If a metric isn’t driving meaningful action or sparking valuable discussions, it might be time to let it go.
"Failing isn't as critical when your IT department is going to quickly and constantly change and improve" – Nicolas Avila, CTO for North America at Globant [22].
Use metrics as a tool to uncover bottlenecks and find areas for growth. When used right, they shift from being a source of stress to a foundation for sustainable team development. Metrics should empower your team, not police them, fostering a culture of trust and progress.
FAQs
How can technical teams ensure their performance metrics support business goals?
To ensure performance metrics genuinely support business goals, technical teams need to focus on key performance indicators (KPIs) that mirror the organisation's priorities. These could include things like how quickly projects are delivered, the quality of the code, or how happy customers are with the end product. The idea is to connect the team's technical work to outcomes that can be measured and clearly linked to business success. When goals are clear and easy for both technical and non-technical stakeholders to grasp, it builds transparency and trust across the board.
The choice of metrics should match the team’s current stage and objectives. For example, a newer team might concentrate on cutting down bugs, whereas a more established one could aim to speed up deployment cycles or enhance teamwork. Regularly revisiting and tweaking these KPIs is key - what worked six months ago might not be as relevant today. By taking a collaborative approach and involving leadership, teams can ensure their metrics stay meaningful and continue to support the bigger picture over time.
What mistakes should you avoid when setting up performance metrics for tech teams?
When setting up performance metrics for tech teams, steer clear of vanity metrics - things like lines of code written or hours logged. These might look impressive on paper but rarely give you any real insight into the team's effectiveness or the value they're delivering. Instead, focus on metrics that track meaningful impact, like how often deployments happen or the quality of the code being shipped.
It's important to use metrics wisely. If they're handled poorly, they can breed mistrust or even lead to micromanagement, which is a surefire way to sink team morale. Metrics should be about building trust and encouraging continuous improvement, not about keeping tabs on every move your team makes. Also, don't overwhelm yourself (or your team) by tracking too many things at once. Stick to a handful of key indicators that align with your goals - something like lead time or deployment success rate can be a good starting point.
And here’s the kicker: numbers alone don’t tell the whole story. Always consider the context behind the data. Pair your metrics with qualitative insights - like feedback from retrospectives - and make time to review them regularly. This ensures they’re driving the behaviours and outcomes you actually want, rather than just ticking boxes.
Why is it crucial to balance speed and quality when measuring tech team performance?
Balancing speed and quality within tech teams is a tricky but essential juggling act. Get it wrong, and you’re either rushing out features that crumble under pressure or moving so cautiously that you risk being left behind by competitors. Nail the balance, though, and you’re looking at consistent delivery without compromising on stability or long-term success.
If you focus purely on speed, you might ship quickly, but you’ll likely rack up technical debt, introduce bugs, and frustrate users with a subpar experience. On the flip side, obsessing over perfect quality can grind progress to a halt, stifling creativity and innovation.
The sweet spot lies in striking the right balance. When teams manage this, they can meet deadlines without cutting corners, keep their output to a high standard, and build trust with both stakeholders and users. It’s not just about the work either - this equilibrium can boost team morale, creating a healthier and more productive working environment.